Welcome to the 114th edition of The Week in Polls (TWIP), which takes a look at the state of play in the general election, as summarised in 10 graphs.
Then it’s a look at the latest voting intention polls followed by, for paid-for subscribers, 10 insights from the last week’s polling and analysis. (If you’re a free subscriber, sign up for a free trial here to see what you’re missing.)
Paid-for subscribers will also get a bonus edition in the week, ahead of polling day, with an extract from Polling UnPacked about the history of exit polls, and the spookily accurate (or lucky?) very first one in the UK.
First though, for readers looking for insider indicators other than polling data, I can report that the volume of chocolate snacks at Lib Dem campaign HQ has increased. Extrapolate from that to Bicester and Woodstock as you wish.
Been forwarded this email by someone else? Sign up to get your own copy here.
Want to know more about political polling? Get my book Polling UnPacked: the history, uses and abuses of political opinion polling.
One election, ten graphs, one story
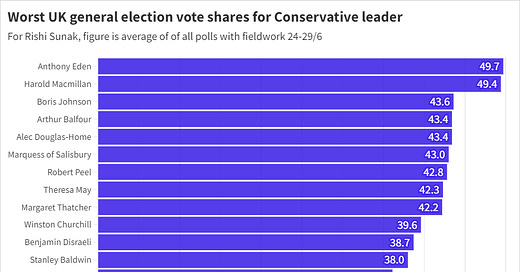
1. Where the Conservatives stand
A final outing for my Duke of Wellington graph (caveats, definitions, justifications of that Winston Churchill vote share figure, etc. here). Here is how the current Conservative standing in the polls compares with the worst general election result for every previous Conservative leader, going back to the Duke of Wellington:1
Summary: Anthony King’s meteor metaphor may get a fresh outing.2
2 & 3. Where the party leaders stand
Exact figures for leader approval vary significantly depending on the question wording, but the trends and relative standings are similar across those different wordings.
To show that therefore here are two graphs, one each from BMG and YouGov:
Summary: for Labour, Starmer’s ratings may not be stellar, but they are well ahead of Sunak and they are not plunging. That’s certainly good enough this side of polling day, though may raise some challenges post-polling day. The level of don’t knows for Ed Davey are still noticeably higher than for Sunak and Starmer, but you can see the impact of the paddleboards and waterslides just as, for Sunak, you can see the impact of D-Day and gambling.
4. Where the voters stand
Perhaps the most surprising polling finding of the election is that despite the return of Nigel Farage and the rise of Reform in the polls, immigration has not risen in importance in the public’s eyes. A reminder of how hard it is to change what matters to the public, unless you are the government.
Again, different pollsters with different questions get different looking results, but the overall patterns are consistent. So for some variety here this time is data from More in Common:
Summary: although declining inflation has seen some easing of the importance of cost of living to the public, it still dominates. It’s notable too that the NHS rates very highly, yet it’s not an issue that the Conservative campaign is saying that much about.3
5. Where the undecideds stand
Similar data also from YouGov for England.
Summary: although the undecideds are disproportionately 2019 Conservative voters, there still isn’t any sign they are going to break particularly favourably for the government.
6. Where the government stands
Summary: I always find this graph a healthy reminder about how little the excitements inside politics register with most voters. Most of it is about as flat as can be without having a data entry error, with if anything a slightly deterioration in the government’s position most recently.
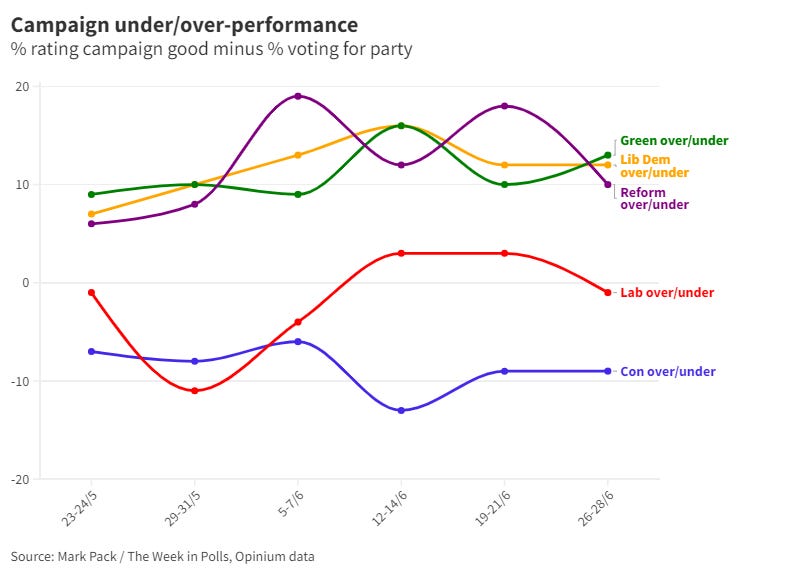
7. Where the campaigns stand
An update to last time’s graph about campaign performance (with the methodology explained here):
Summary: the public has not particularly warmed to Labour’s campaign on these figures, but from their perspective the more important point is that the public hasn’t been put off. The Ming Vase is being safely carried. Again, it is a graph that shows Conservative hopes of using the campaign to revive their fortunes are not being met, so far.
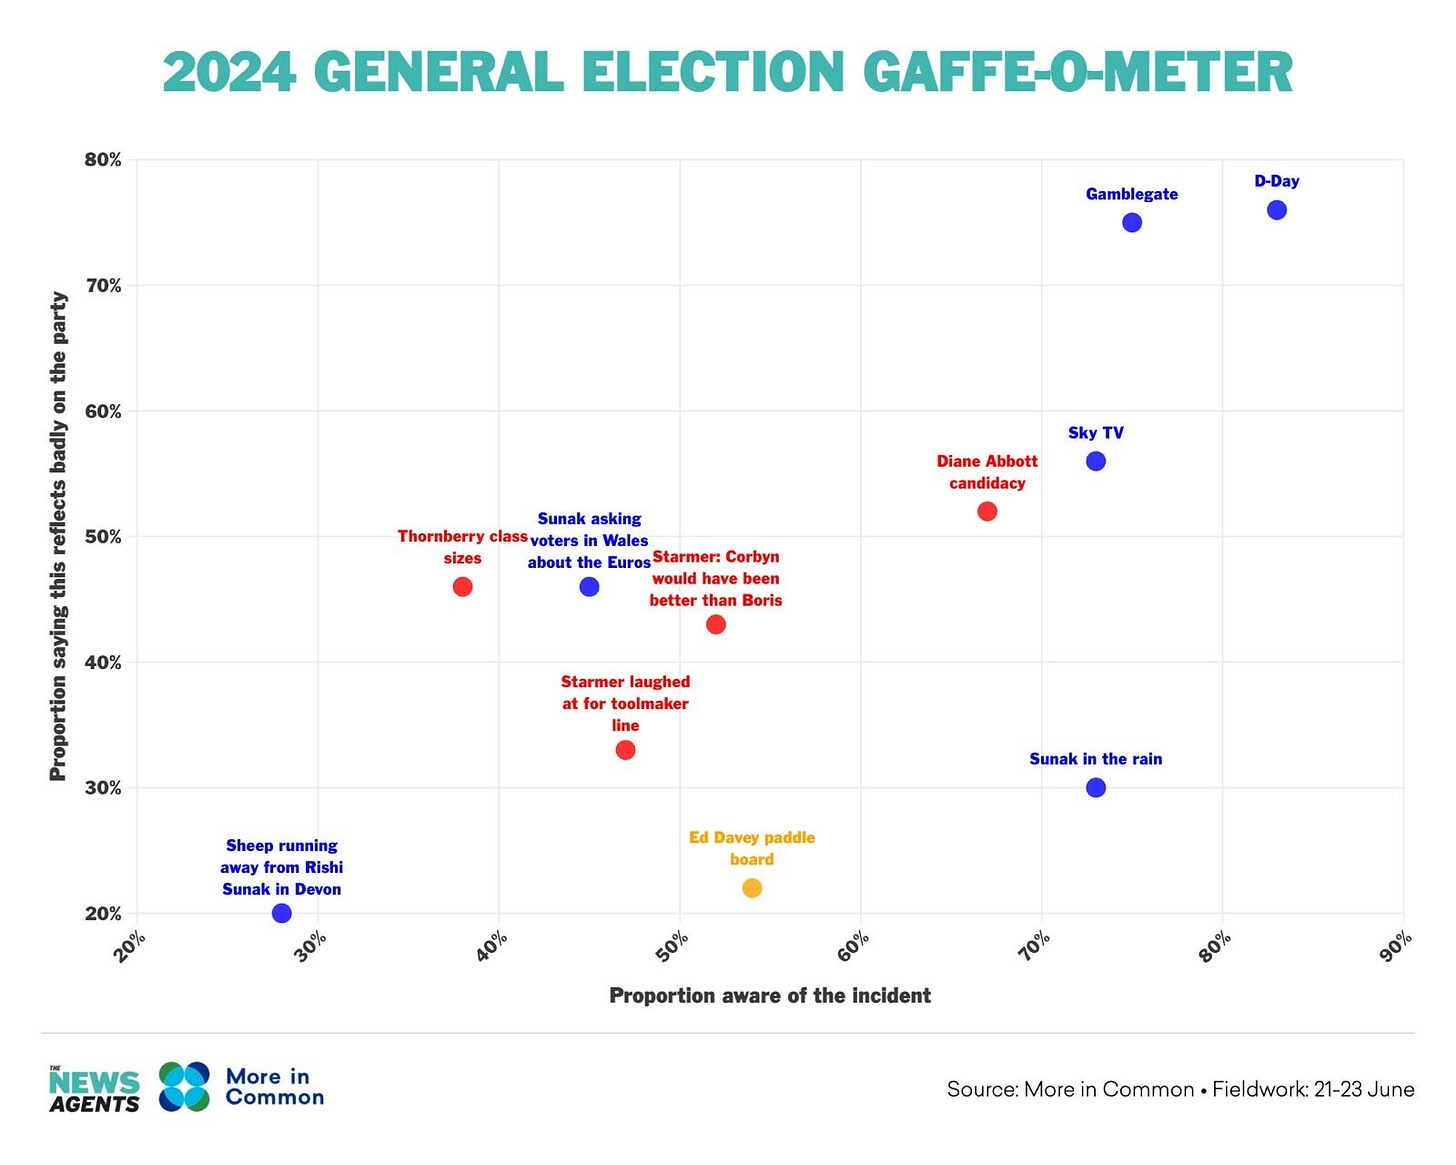
8. Where the public’s attention stands
Which (supposed)4 gaffes have the public noticed, and does the public think poorly of them? More in Common has some neat data:
Summary: the things the public have both noticed most and think worst of are all about the Conservative campaign.
9. Where the seat projections stand
I’ve quoted before the excellent summaries by Stephen Fisher and colleagues of what different seat projection approaches have been saying during this election. Here’s how the overall picture has been changing (and note that the Y-axis starts at 100):5
Summary: the spread between the figures generated by the different methods is striking when plotted like this. There will be plenty to digest when we know where reality ends up. But we do know one reason for the range of results being produced, as the final graph shows…
10. Why the seat projections are fragile
The ever-excellent John Burn-Murdoch from the Financial Times illustrates why it’s a hard election for seat forecasters: the Conservative support is in the range where a small change in vote share makes the biggest change to seat numbers.
National voting intention polls
Lots of polls, lots of different methodologies, but all pretty much the same picture with one important exception: the Conservative-Reform gap. PeoplePolling has Reform 6 points ahead of the Conservatives, Whitestone has them 3 points ahead, but every other pollster has the Conservatives ahead, even by double digit margins.
So while it’s unlikely we’re about to have a big polling miss, there will - unless we have a huge convergence in the last few days - be some pollsters needing to wonder why they got at least part of their polls wrong.
For more details and updates through the week, see my daily updated table here and for all the historic figures, including Parliamentary by-election polls, see PollBase.
Last week’s edition
Which campaigns are doing best?
My privacy policy and related legal information is available here. Links to purchase books online are usually affiliate links which pay a commission for each sale. Please note that if you are subscribed to other email lists of mine, unsubscribing from this list will not automatically remove you from the other lists. If you wish to be removed from all lists, simply hit reply and let me know.
The MRP figures I’m sure that will be wrong, and other polling news
The following 10 findings from the most recent polls and analysis are for paying subscribers only, but you can sign up for a free trial to read them straight away.
Keep reading with a 7-day free trial
Subscribe to The Week in Polls to keep reading this post and get 7 days of free access to the full post archives.


