Welcome to the 81st edition of The Week in Polls, which looks at how current voting intention figures for the Conservatives compare with the past. How bad are things, really?
Then it’s a look at the latest voting intention polls followed by, for paid-for subscribers, 10 insights from the last week’s polling and analysis. (If you’re a free subscriber, sign up for a free trial here to see what you’re missing.)
As ever, if you have any feedback or questions prompted by what follows, or spotted some other recent polling you’d like to see covered, just hit reply. I personally read every response.
Been forwarded this email by someone else? Sign up to get your own copy here.
Want to know more about political polling? Get my book Polling UnPacked: the history, uses and abuses of political opinion polling.
Or for more news about the Lib Dems specifically, get the free monthly Liberal Democrat Newswire.
How bad are the Conservative voting intention figures?
It’s been a low-key running theme in this newsletter that the current Conservative voting intention figures aren’t just poor, nor bad, but really awful - and that the scale of their awfulness is being under-appreciated. Hence my occasional references to Michael Foot and the jibe last time around about the Conservatives polling worse than even the all-time record holder for bad general Conservative election results, the Duke of Wellington, even whilst acknowledging in the ‘list of 10’ round-up some glimmers of hope for the Conservatives in the latest polling of the “don’t knows”.
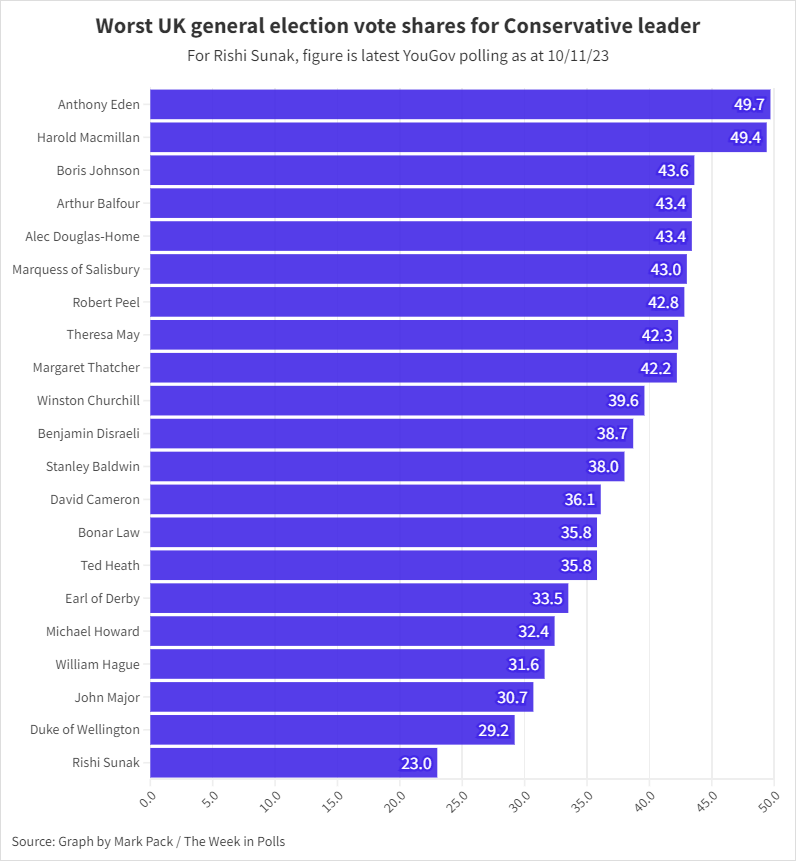
Let’s this time therefore put the current voting intention figures in some context. Taking the latest YouGov1 voting intention figures for Rishi Sunak and comparing them with the worst general election result for each of his predecessors since the Great Reform Act,2 this is how they compare:
I think we can agree that doing at least six points worse than the worst result for your worst predecessor is sub-optimal.
Before looking at some other context for the current Conservative polling numbers, I know that the proper electoral geeks among my readers will have a thing or two to say about the details in that bar chart.
So to try to head off a few queries: (a) Conservative leaders who did so badly they were ousted before getting to a general election are excluded; (b) for leaders who fought more than one election, it’s their worst result included; (c) the figures are UK vote shares, i.e. including (Northern) Ireland; (d) the correct exact percentages for election vote shares are frustratingly difficult to pin down as Jack Bailey has pointed out and they get even more complicated when we get back to the world of multi-member constituencies and then further back to the world when it was common for many seats not to be contested; so don’t be surprised if you’ve seen a different voting percentage figure from any of those in the table; and (e) one consequence is that it’s unclear whether the Conservatives under Bonar Law polled a lower percentage in 1918 or in 1922 so the graph may be wrong on that but the vote share figure would still be very similar.
Right, back to current times and a more substantive objection wise readers will have is that the table compares current polling ahead of a general election with previous general election results. Those aren’t the same thing. The table is comparing one apple with lots of oranges. Which is a fair point. (Although I would point out that you can compare apples and oranges. If I have 1 apple and you have 3,000 oranges, we wouldn’t have much trouble figuring out which of us has the most fruit.3)
So let’s also look at how the current voting intention figures compare with previous Parliaments at this stage.
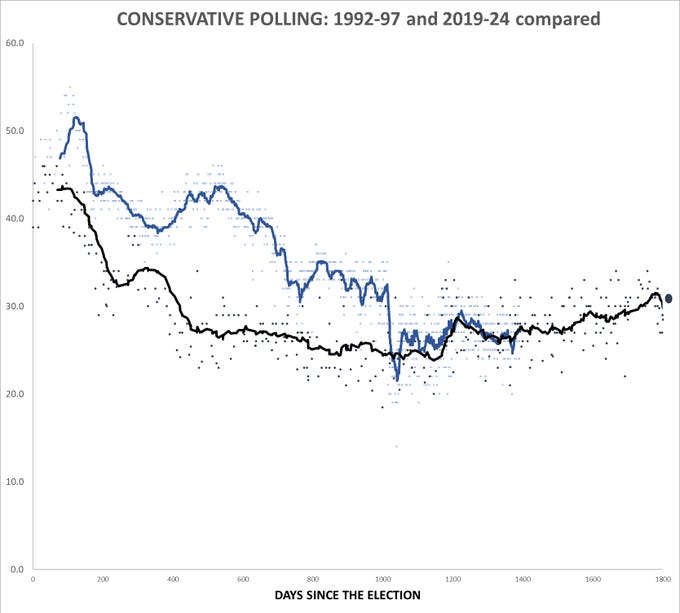
First up, here is one of the graphs from Giles Wilkes comparing this Parliament with the 1992-97 one which ended in that entry for John Major in the table above:
Next, let’s look at the Labour lead, courtesy of a graph from Owen Winter:
He also points out that current Conservative polling levels are among the four worst lows for any government since polling started up.
In other words, the Conservatives are currently at levels that match William Hague at this stage in the Parliament on the road to landslide defeat and which are noticeably worse than the typical ratings for governments at this stage in the Parliament that go on to lose.
Of course mindful of the way all this will live on the internet well beyond us knowing the result of the next general election, there’s an important caveat/piece of self-preservation to add. Which is that things can change. The unprecedented can happen.
But for the moment, it’s true to say that, measured by vote share, the Conservatives are on course not only for a heavy defeat but possibly their worst in history. Something very drastic would have to change to avert that - and perhaps punditry at the moment isn’t spending enough time speculating on what that sort of scale of defeat would mean for British politics?
Know other people interested in political polling?
Refer friends to sign-up to The Week in Polls too and you can get up to 6 months of free subscription to the paid-for version of this newsletter.
National voting intention polls
Yes, once again it was a week without a poll putting the Conservatives on more than 30%, extending the run stretching back to late June (when a Savanta poll gave them 31%).
Here are the latest figures from each currently active pollster:
For more details and updates through the week, see my daily updated table here and for all the historic figures, including Parliamentary by-election polls, see PollBase.
Last week’s edition
Where is the British public headed on culture war issues?
My privacy policy and related legal information is available here. Links to purchase books online are usually affiliate links which pay a commission for each sale. Please note that if you are subscribed to other email lists of mine, unsubscribing from this list will not automatically remove you from the other lists. If you wish to be removed from all lists, simply hit reply and let me know.
Views of Suella Braverman, and other polling news
The following 10 findings from the most recent polls and analysis are for paying subscribers only, but you can sign up for a free trial to read them straight away.
Keep reading with a 7-day free trial
Subscribe to The Week in Polls to keep reading this post and get 7 days of free access to the full post archives.


