Fragile figures? The Telegraph and polling on Islamophobia
Welcome to the 171st edition of The Week in Polls (TWIP), which goes back to this newsletter’s roots. One poll, one newspaper story - but is there only the one story to tell, or does digging into the evidence give us a different story from the one in the newspaper?
Next comes a summary of the latest national voting intention polls, seat numbers from the latest MRPs and a round-up of party leader ratings.
These are followed, for paying subscribers, by 10 insights from the latest polling and analysis.
This time, those ten include the history of how support in the polls for new parties grows, or fades.
This week’s raised eyebrows come courtesy of an anti-opinion polls piece in The Guardian. Much could be written about what the piece gets wrong - indeed, in many ways I have written a whole book about that - but the issues with this piece this can be condensed to two.
First, the piece reads - to me at least - rather as if someone has just been taught about gravity and is now anxious to tell everyone what a con the aeroplane industry must be. The problems mentioned are real, but the industry has been grappling with them, largely successfully, for decades.
Second, as the piece says:
So what is it exactly that opinion polls measure? A random sample, hopefully statistically reliable, of differing and irreconcilable opinions. Not informed opinions exclusively, of course, but also the opinions of conspiracy theorists, the news-phobic and the merely deranged.
And the point is…? That sounds to me horribly close to arguing that the problem with opinion polls is that they include the views of people the author doesn’t think much of.
I’d argue the opposite: that is exactly why opinion polls are good. They are an engine of equalisation in which every respondent has the same voice, however rich they are, whoever they went to university with and regardless of whether they have a newspaper column. That is not a problem at all.1
And with that, on with the show.
Want to know more about political polling? Get my book - Polling UnPacked: the history, uses and abuses of political opinion polling.
Would a new definition of Islamophobia give Reform a 100-seat majority?
Last Sunday, a Telegraph headline asserted:
Angela Rayner’s proposal for an official definition of Islamophobia would hand Reform a 100-seat majority at the expense of Labour, a poll has found.2
It went on:
A survey of 2,000 people has found that Labour polls significantly worse among voters who are told about the Islamophobia plan … Bringing in the definition would cause a loss of one million votes to Labour, and a fall in its seats in the Commons from 155 to 103.
We even get a graphic with a “loss of one million votes” label and an arrow indicating a fall in the Labour vote.
Nor is this just the interpretation of the newspaper, for it also quotes the relevant pollster, James Johnson of JL Partners:
This polling shows that if Labour introduces a new definition of Islamophobia, it would be like setting off a tinderbox under what remains of their working-class vote.
All very clear, very certain and very dramatic.
Does the poll back that up?
For a start, it is only one poll from just the one pollster, albeit one of the more accurate pollsters at the 2024 general election.
But as the piece itself also says, the movements in support involved are pretty small. People were asked who they would vote for and then asked again who they would vote for if Labour introduced a new definition of Islamophobia. The changes in vote share intention between those two questions were:
Labour: -2.4%
Green: -0.4%
Lib Dem: +0.6%
Conservative: +0.7%
Reform: +1.6%
I have calculated these numbers based on excluding don’t knows (as is standard for presenting vote share figures), and I have calculated the exact percentage for both vote share questions before taking the difference between them.
If you round off the vote share figures to the nearest whole number before taking the difference, that puffs up the Labour vote share loss to 3%. Which may be where the Telegraph got its reported 3 per cent loss from. But that exaggerates the difference by a quarter,3 or in the Telegraph’s terminology, by hundreds of thousands of votes.
That is a knock to the Labour vote, certainly. But a fall of (only) 2.4% is one that should give us lots of pause for thought.
For a start, it’s a small change, and polls are not microscopically precise measuring instruments. Indeed, the changes are not all neatly lined up in the way you might expect. (Lib Dem vote share going up?) A loss of a million votes sounds large; a loss of 2.4%, bearing in mind the typical error rates in polls, sounds rather less large.
Further, the second vote question also focuses people’s attention on just the one topic: “Imagine the Labour government enacted this definition. Which party would you vote for if there were a general election tomorrow?” That is not how people decide how to vote in practice; they would take into account many other issues too.
Such wording always risks exaggerating the impact of the policy mention - and indeed often has in the past when similar questions have been asked, the policy happened and then vote shares not moving as ‘predicted’ by those earlier polls. Back in his blogging days, Anthony Wells often wrote entertaining pieces pulling apart the (mis)use of such questions.
Moreover, the two vote share questions did not come back to back. Rather, the pollster asked 45 other questions in-between the two. Some of these were on topics such as Islamist extremism and others were about Labour’s record in government.
So there is a risk that the poll primed people: it made them think of possible negative things about Muslims and made them think of possible negative things about the government more generally before coming to that final voting question. Which gives us good reason to doubt how much the fall in Labour vote shown by that final question is due to the possible impact of a new definition of Islamophobia from the government and how much is due to other factors.
In other words, the fall may not be a picture of reality but a mirage produced by the poll.
Plus of course there’s always good reason to doubt a confident precise conversion of vote share figures from a national poll into seat tallies in the House of Commons.
More doubts come from the details of some of those other poll questions. The poll also asked:
If Keir Starmer and the Labour government spent more time on each of these issues, would it make you more or less likely to vote for them in the future? Tackling Islamophobia…
25% said it would make them more likely to vote for Starmer and the Labour government and… 13% said it would make them less likely.
These sort of hypothetical voting questions on topics do not have great predictive qualities about what people will do if the hypothetical becomes real. But the results here give extra reason to think that the impact of the 45 intervening questions and/or the wording of the final voting question may have rather skewed the figures.
Other questions in the poll also suggest a more split public over the necessity for more action on Islamophobia than the tenor of the newspaper piece’s headline and opening suggest. For example it is only by a slim four points on 30%-26% that people say that “protections against Islamophobia in society currently are going too far” rather than “haven’t gone far enough”.
Some of this other detail is given at the end of the Telegraph story, to be fair.
Overall though, we have a picture of the vote share changes are small, the changes are based on a methodology prone to exaggerate the apparent impact of an issue, there is a risk that the changes are skewed by the large number of intervening questions and other questions hint at a more nuanced picture. They are all also from just the one poll.4
That all leaves us a quite a long way from the certainty handing Reform a 100 seat majority and setting off a tinderbox.
Case not proven, as they say in Scotland.
Thanks to JL Partners for answering my query about their poll very promptly and outside of business hours. It was to ask for further details of how the Islamophobia definition was described in the poll, details which they said they will also add to their website next week. A win once again for polling transparency in the UK. I have not gone into that wording above as, to my eyes, it looks pretty reasonable and in itself unlikely to skew the numbers one way or the other.5
Voting intentions and leadership ratings
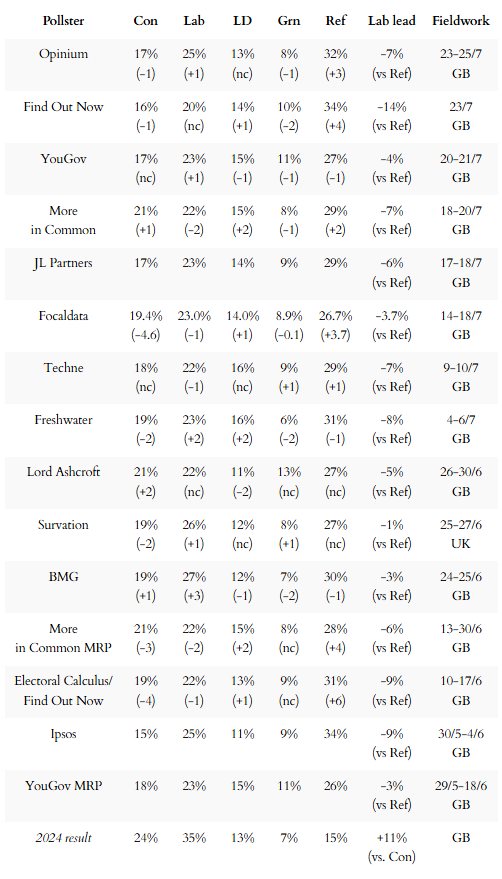
Here are the latest national voting intention figures from each of the pollsters currently active, with Find Out Now once again a bit of an outlier on support for Reform. During the week, the pollster published an explainer on why they think this is (and why they think they are right).
Next, the latest seat projections from MRP models and similar, also sorted by fieldwork dates. As these are infrequent, note how old some of the ‘latest’ data is. Note also how close the Conservative Party is to falling to fourth or even, with some models, fifth (!) on seats.
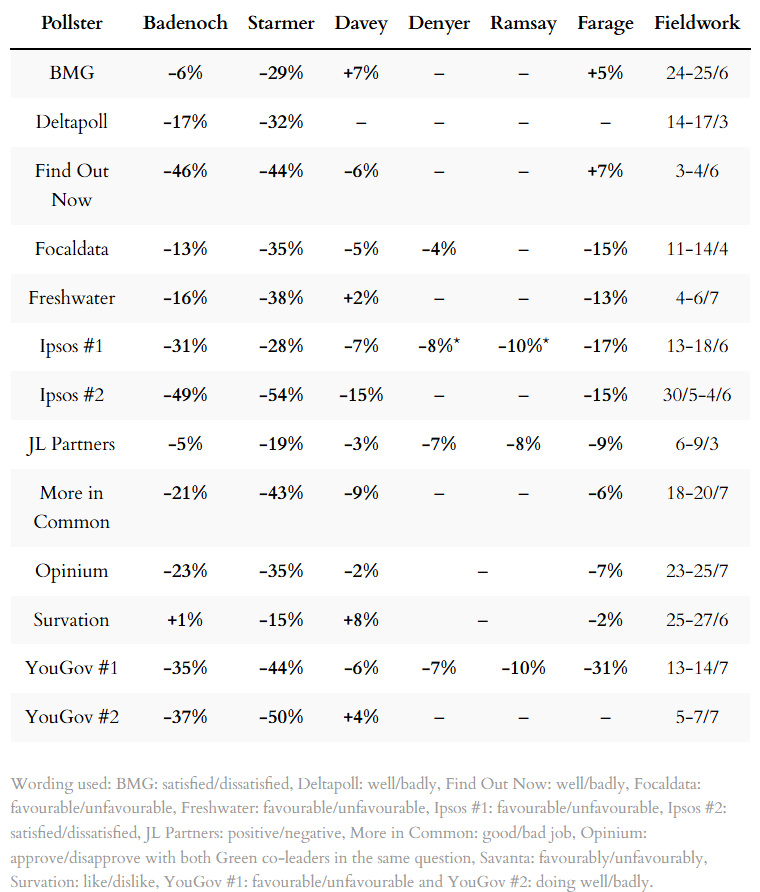
Finally, a summary of the latest leadership ratings, sorted by name of pollster.
For more details, and updates during the week as each new poll comes out, see my regularly updated tables here and follow The Week in Polls on Bluesky.
For the historic figures, including Parliamentary by-election polls, see PollBase.
Catch-up: the previous two editions
My privacy policy and other legal information are available here. Links to purchase books online are usually affiliate links which pay a commission for each sale. For content from YouGov the copyright information is: “YouGov Plc, 2018, © All rights reserved”.6
Quotes from social media messages are sometimes lightly edited for punctuation and clarity.
If you are subscribed to other email lists of mine, please note that unsubscribing from this one won’t automatically remove you from the others. If you wish to be removed from all lists, simply hit reply and let me know.
How early polling for Corbyn-Sultana new party compares with Change UK, and other polling news
The following 10 findings from the most recent polls and analysis are for paying subscribers only, but you can sign up for a free trial to read them straight away.
Owen Winter is back with a graph showing how the early hypothetical polling for the new Corbyn-Sultana party stacks up, and points out that its average 11% is the
Keep reading with a 7-day free trial
Subscribe to The Week in Polls to keep reading this post and get 7 days of free access to the full post archives.


