


Reality arrives, 2025 edition: how did the polls and projections do?
Welcome to the 159th edition of The Week in Polls (TWIP) which takes a look at how the polls and predictions performed in the local elections we have just had. That is followed by eight bonus graphs which help tell the wider story of the elections.
Then it is a summary of the latest national voting intention polls and a round-up of party leader ratings.
Those are followed by, for paid-for subscribers, 10 insights from the last week’s polling and analysis.
This time, those ten include a note of caution about pro-European views found in political polls.
If you are not yet a paid-for subscriber, you can sign up for a free trial now to read that and all the other stories:
One thing not included below is
’s excellent piece on ‘Reform curious’ Labour voters as that deserve more space than there is available this time around. I will cover the piece in more detail next week.Finally, a sigh of exasperation at Sky News for breaking the rule of always comparing like with like when looking at polls and election results.
And with that, on with the show.
Want to know more about political polling? Get my book Polling UnPacked: the history, uses and abuses of political opinion polling.
The polls, the predictions and some graphs
Mayor polling
Elections for Mayors, especially outside London, are greatly underpolled in the UK. Thankfully, both last year and this year there has been an emerging pattern of pollsters producing Mayor polls even without being paid by a media outlet to do so. Of course there is a publicity self-interest for them in doing this. But we should be grateful for their willingness to run such polls - especially as polling Mayor contests is harder than polling general elections. That is because turnout is lower, and the general pattern across countries and decades is that lower turnout equals higher polling errors on average. It is also because the paucity of previous polling means it is harder for pollster to calibrate their models well.
So, thank you pollsters. Now let us see how you did…

There are a lot of numbers in that table (and you can tap/click on it to go to a larger version). The broad picture for the pollsters is - mostly - pretty good, with respectably low mean average errors and with the polls getting the big picture right.
But only mostly.
If you judge polls by whether they get the top two right - i.e. whether they rightly inform the media and the public about who the frontrunners are when deciding who to interview, how to vote tactically, etc. - then eight polls got that right and five got it wrong. More than one in three polls calling that wrong is not great.
The margin of those errors involved in those mistakes was, to be fair, in some cases very small, and in five party politics, small errors count for more. But polls need to rise to that challenge.
The polls did not provide a good guide to what was happening in the Hull & East Yorkshire contest, with two of the three failing to show it as the Reform / Lib Dem two horse race that the results (and the Lib Dem barcharts) said it was. The one that had the correct top two was marred by showing a much larger lead than reality delivered. The YouGov miss on the Green Party in West of England was also noticeable.
Overall, then, a decent showing for the pollsters, but not more than that.
What I wrote last year after that round of Mayor polls therefore applies again this time:
A decent set of polls then …
One possible reason for the polls not being more accurate is that they were not done that close to polling day itself.1 In general elections, the final poll on which the reputation of pollsters rest is nearly always done right up against the end of the campaign. That is to guard against being caught out by late swing meaning reality shifts between the poll and the result. Doing polls earlier lets pollsters get more media coverage and social media publicity out of them - and if that helps encourage them to do the polls, let’s not begrudge that.
One final point to note: Find Out Now’s national voting intention polls are currently the outlier, giving Reform much better results than other firms. But on mean average error measure, their polls were the most accurate in the Mayor contests.
Seat predictions
This time around we had six set of public seat predictions, based on a variety of methodologies, including statistical models and more qualitative assessments.
Here is how they performed:

Overall, the predictions were roughly right, and in particular this time Electoral Calculus did pretty well. Its local elections predictions have a rather mixed record but this time it is only its error on the Green Party that stands out. To its credit, this time it did get the picture about the Liberal Democrats roughly right, something it often has not in the past.
UPDATE: Apologies, I used the wrong figures for Electoral Calculus as I used the figures for all the areas which were originally scheduled to have elections rather than the figures just for those areas which did have elections (i.e. excluding those where elections were postponed due to local government reorganisation). The corrected figures are here. They are less flatting to Electoral Calculus, and therefore the firm deserves particular credit for drawing the error to my attention.
Probably the ‘break out prediction star’ this time was Politics UK: bang on for Greens, very close on Labour, second best on Reform, second best on Lib Dems and joint second best on Conservatives. I will plead guilty to having read their methodology in advance and being pretty unsure about how well it would do. I will need to go back and read it again with renewed appreciation.
All the predictions roughly right then, but also with sufficiently large and regular errors in the numbers to remind us to treat these sort of predictions as only very broad brush. For all the apparent precision of detailed figures down to the last seat, the reality of their accuracy is not nearly so precise.
In particular, all but one of the predictions though was on the low side on the Liberal Democrat gains and also all but one were on the low side on Reform’s gains.
Moreover, last year I wrote of the 2024 predictions that, “It’s notable that Labour consistently underperformed the predicted gains.” The same happened again this time.
Two data points do not make a law of political science. But perhaps you and I should both remember this come next year?
See you in 2026.
Eight bonus graphs
From Patrick English showing that rising turnout and higher Reform vote share went together:

This goes with a pair of graphs from More in Common, showing that in their Mayor polls, Reform supporters were those keenest to say they would vote:

Their second graph shows that what Reform seems to have done is to successfully mobilise lower turnout voters, something that was a feature of the Brexit Referendum too. That can make for a dramatic result, but also can be a brittle base for future success:

As turnout and levels of formal education are correlated, it is not a surprise that the Sky News team finds Reform did best in areas with more people without qualifications:

Rob Ford shows the same point with other education related data, adding too that the Lib Dems showed the reverse pattern:

This pattern of vote share versus education mirrors what happened with UKIP, and hence no surprise too that Reform did best where Ukip did best. In that sense this time was a dramatic exaggeration of a previous political landscape rather than a new one:

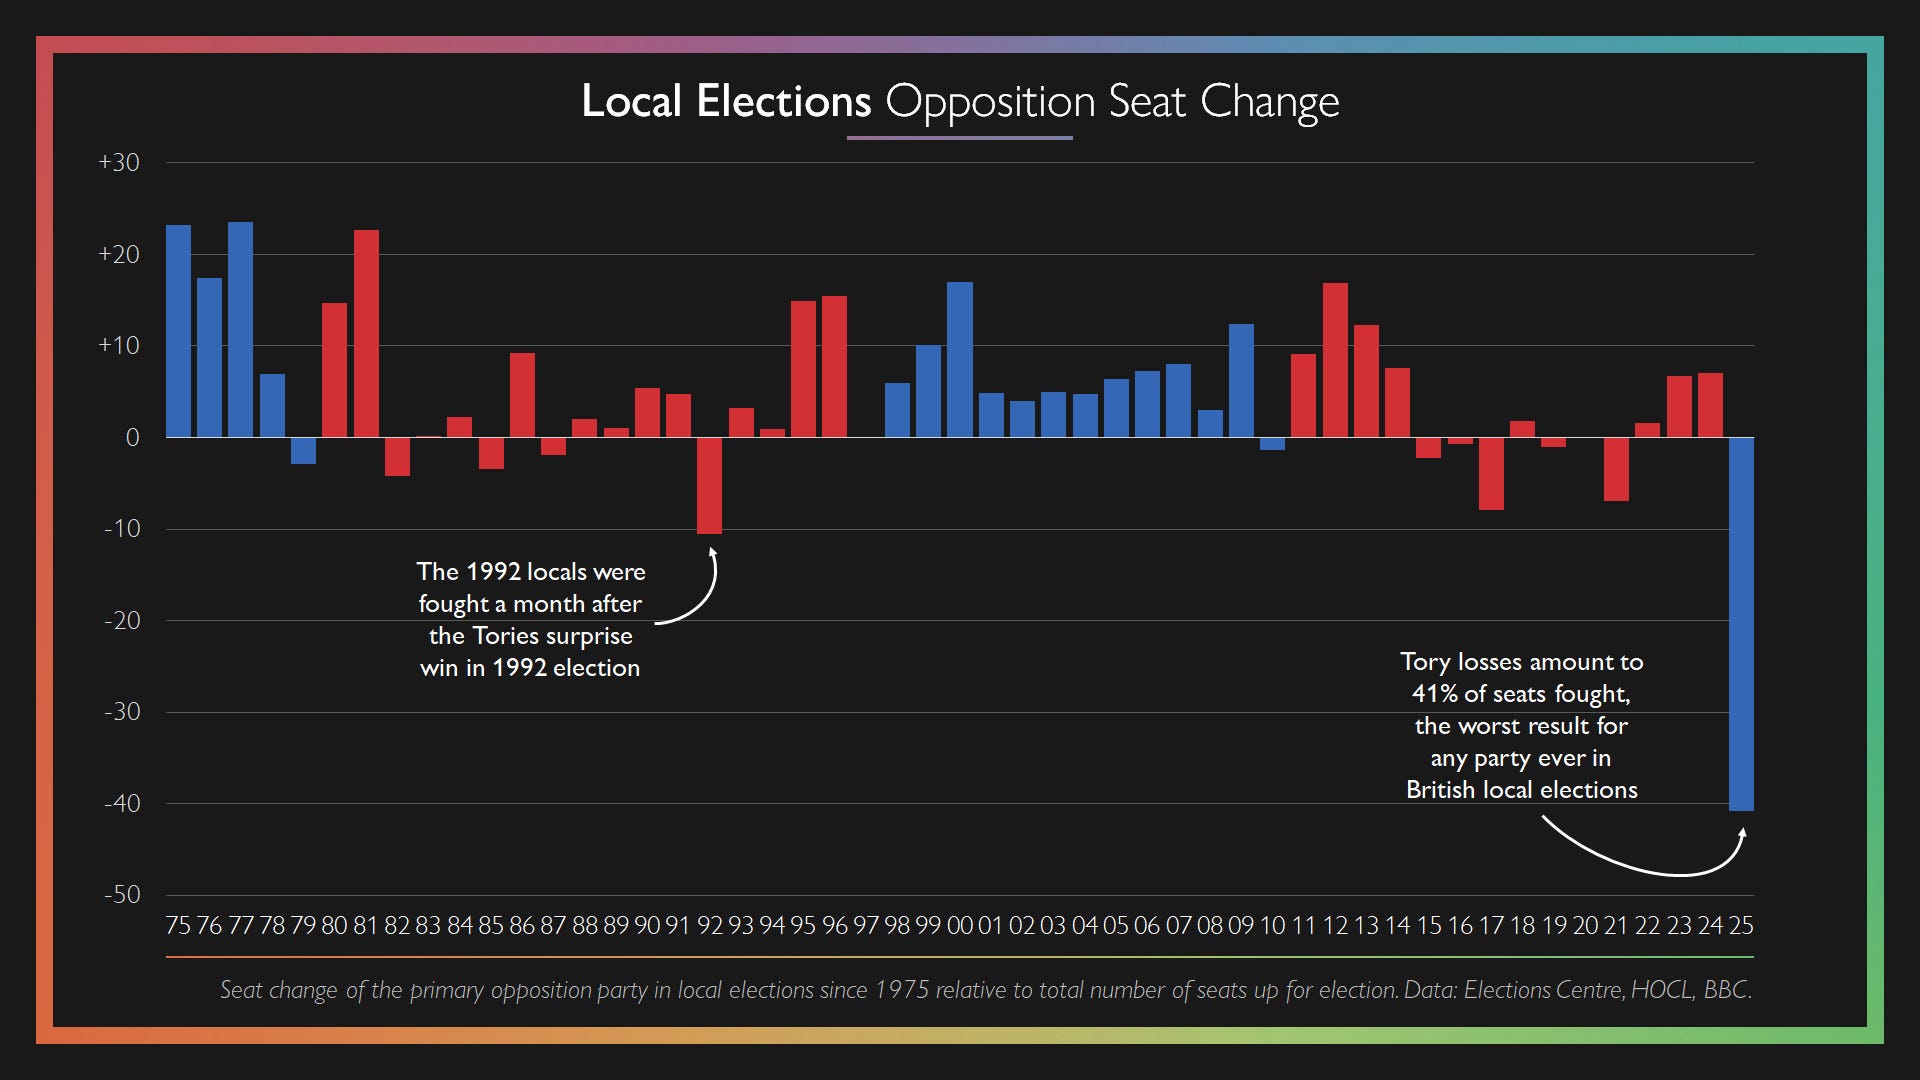
And where were the Conservatives in all this? Dylan Difford’s graph answers that starkly:
Which all leaves the old two party system rather battered:

Voting intentions and leadership ratings
Here are the latest national general election voting intention polls, sorted by fieldwork dates.

Next, the latest seat projections from MRP models and similar, also sorted by fieldwork dates:

Rob Ford has a good thread on the limitations of such seat projections this far out from a general election.
Finally, a summary of the latest leadership ratings, sorted by name of pollster:

For more details, and updates during the week as each new poll comes out, see my regularly updated tables here and follow The Week in Polls on Bluesky.
For the historic figures, including Parliamentary by-election polls, see PollBase.
Catch-up: the previous two editions


My privacy policy and related legal information is available here. Links to purchase books online are usually affiliate links which pay a commission for each sale. For content from YouGov the copyright information is: “YouGov Plc, 2018, © All rights reserved”.2
Quotes from people’s social media messages sometimes include small edits for punctuation and other clarity.
Please note that if you are subscribed to other email lists of mine, unsubscribing from this list will not automatically remove you from the other lists. If you wish to be removed from all lists, simply hit reply and let me know.
What the public says about a Conservative/ Reform merger, and other polling news
The following 10 findings from the most recent polls and analysis are for paying subscribers only, but you can sign up for a free trial to read them straight away.
Polling of Reform and Conservative Party voters about a possible merger between
Keep reading with a 7-day free trial
Subscribe to The Week in Polls to keep reading this post and get 7 days of free access to the full post archives.