Welcome to the 158th edition of The Week in Polls (TWIP) which explains how the national vote share calculations are done after each round of May local elections - and provides some pointers on what they do and don’t mean.
Then it is a summary of the latest national voting intention polls and a round-up of party leader ratings.
Those are followed by, for paid-for subscribers, 10 insights from the last week’s polling and analysis.
This time, those ten include some new data on the importance of potholes for local campaigning.
If you are not yet a paid-for subscriber, you can sign up for a free trial now to read that and all the other stories:
Thank you for the feedback on last week’s edition with the breaking news of Neville Chamberlain’s poll ratings. The occasional foray into polling history appeals to most readers, so expect the occasional appearance of similar posts in future, such as on the curious trajectory of Winston Churchill’s poll ratings during the Second World War or over whether the polls really said that Jim Callaghan should have called a general election in autumn 1978.
And with that, on with the show.
Want to know more about political polling? Get my book Polling UnPacked: the history, uses and abuses of political opinion polling.
PNS and NEV: making national vote share figures out of local elections
Each May1 sees a big round of local elections on the first Thursday of the month. But councillors are elected for either four or five year terms of office and some councils elect all their councillors in one go, some elect one third at a time and some elect a half at a time.2
Add to that the smaller effect of council reorganisations and boundary changes and you end up with a lot of variation from year to year in what seats - and what parts of the country - are up for election.
This variation in what is up each May means that simply tallying up the total votes for each party tells you something,3 but does not let you compare election performance across different years.
Comparing the simple vote totals from one year to another is not comparing like with like.
To tackle this, both John Curtice and Stephen Fisher (PNS, Projected National Share of the vote, the figures used by the BBC), and also another pair of academics, Colin Rallings and Michael Thrasher (NEV, National Equivalent share of the Vote, the figures used by Sky and The Times), independently produce notional national vote share calculations.
What both methods do is extrapolate from the elections that were held to project what the national vote share would have been for each of the main parties if there had been elections everywhere and if the parties had stood in them all.
The two calculations take different approaches. To simplify greatly, the PNS approach focuses on vote shares in a sample of wards from which a nationally representative picture can be extrapolated while the NEV approach focuses more on changes in vote share.
In practice the calculations all become rather messier to do because ward boundaries change (and do not always neatly line up with other relevant geographic units). Nor does every party stand in every place. Nor is each ward up each time. But with enough expertise and enough volume of calculations to smooth out individual oddities, you can get a decent national figure.
UPDATE: John Curtice and Stephen Fisher have a detailed piece out explaining the PNS approach and how it is changing for 2025.
Two reasons to have confidence in the figures
If all this sounds to you like each set of calculations is a long way from being a simple set of authoritative vote totals, you would be right.
Both are projections, models, extrapolations - extending from what we know to a hypothetical (and never real) national Platonic ideal of a world in which every ward was up and in which all the parties stood in each.
Yet we can have confidence in using the numbers. One is that both teams are comprised of respected academics, with their core methodologies exposed to peer research and with no partisan incentive to boost any particular party.
The other is that they are two separate teams, who produce rival figures in different ways for each round of local elections, have done so for years - and consistently come up with very similar answers.

There are sometimes small variations, which is why when comparing trends it is important to compare PNS with PNS and to compare NEV with NEV. But we do not get large or persistent differences and the trends from both sets of calculations are the same.
You can find all the historic figures for both approaches in my LocalBase spreadsheet.
What they do and don’t mean
People do not vote the same way in local and general elections. We know that from when both occur at the same time.
So PNS/NEV are national figures for local elections, not projections for a Westminster general election. Rather, they let us compare overall local election performance over time, even though different seats are up in different years.
There is an important caveat about Scotland and Wales, with their own political systems and local elections only every five years. So PNS/NEV are not well suited for telling us what is happening in those two countries specifically in-between times.
You can project what seat numbers would come out at in the House of Commons if a general election had the same vote shares as the latest PNS/NEV figures. That can be helpful for bringing the figures to life and even be useful if - but only if - compared with similar projections ahead of previous general elections. That gives a sense of relative progress or decline since the same time in the last Parliament. But it should not be taken as a direct prediction for what would happen in a general election called straight away.
For example, if this year’s Thrasher and Rallings figures are projected to put the Conservatives on, say, 200 seats then the sensible comparison is not with the 121 the party won at the July elections (Conservatives bounce back!) but with the 242 seats projected in May 2024 or 238 in May 2023 (Conservatives fall back even further than there were in second half of last Parliament!).
Compared on a like-for-like basis, those seat projects can be not just a bit of fun but also a bit illuminating. But as with comparing PNS and NEV vote share figures - or as with comparing polls in general - it has to be like for like.
Voting intentions and leadership ratings
Here are the latest national general election voting intention polls, sorted by fieldwork dates.
Find Out Now are now well established as the outlier in these figures (though remember that sometimes the outlier is right). It is also now a common occurrence for the Conservatives to be in third.
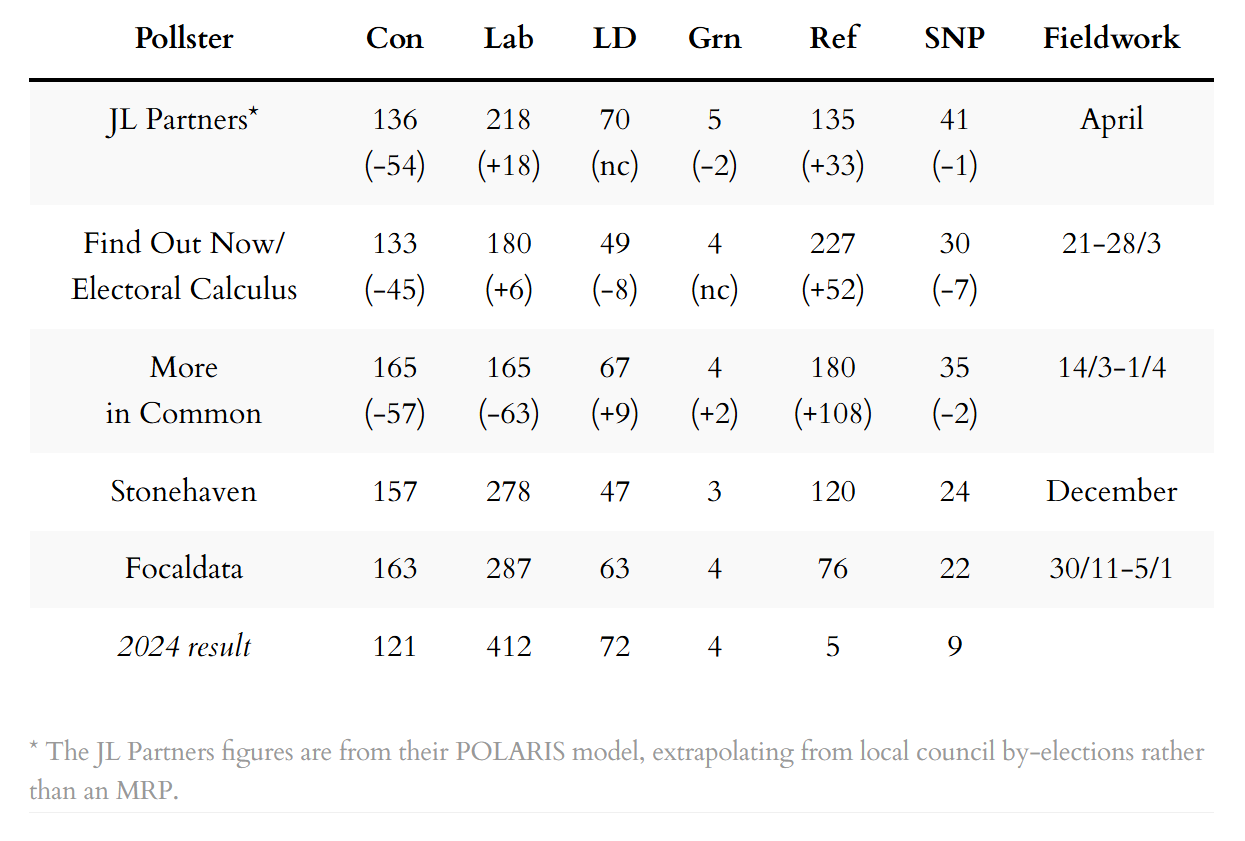
Next, the latest seat projections from MRP models and similar, also sorted by fieldwork dates:
Rob Ford has a good thread on the limitations of such seat projections this far out from a general election.
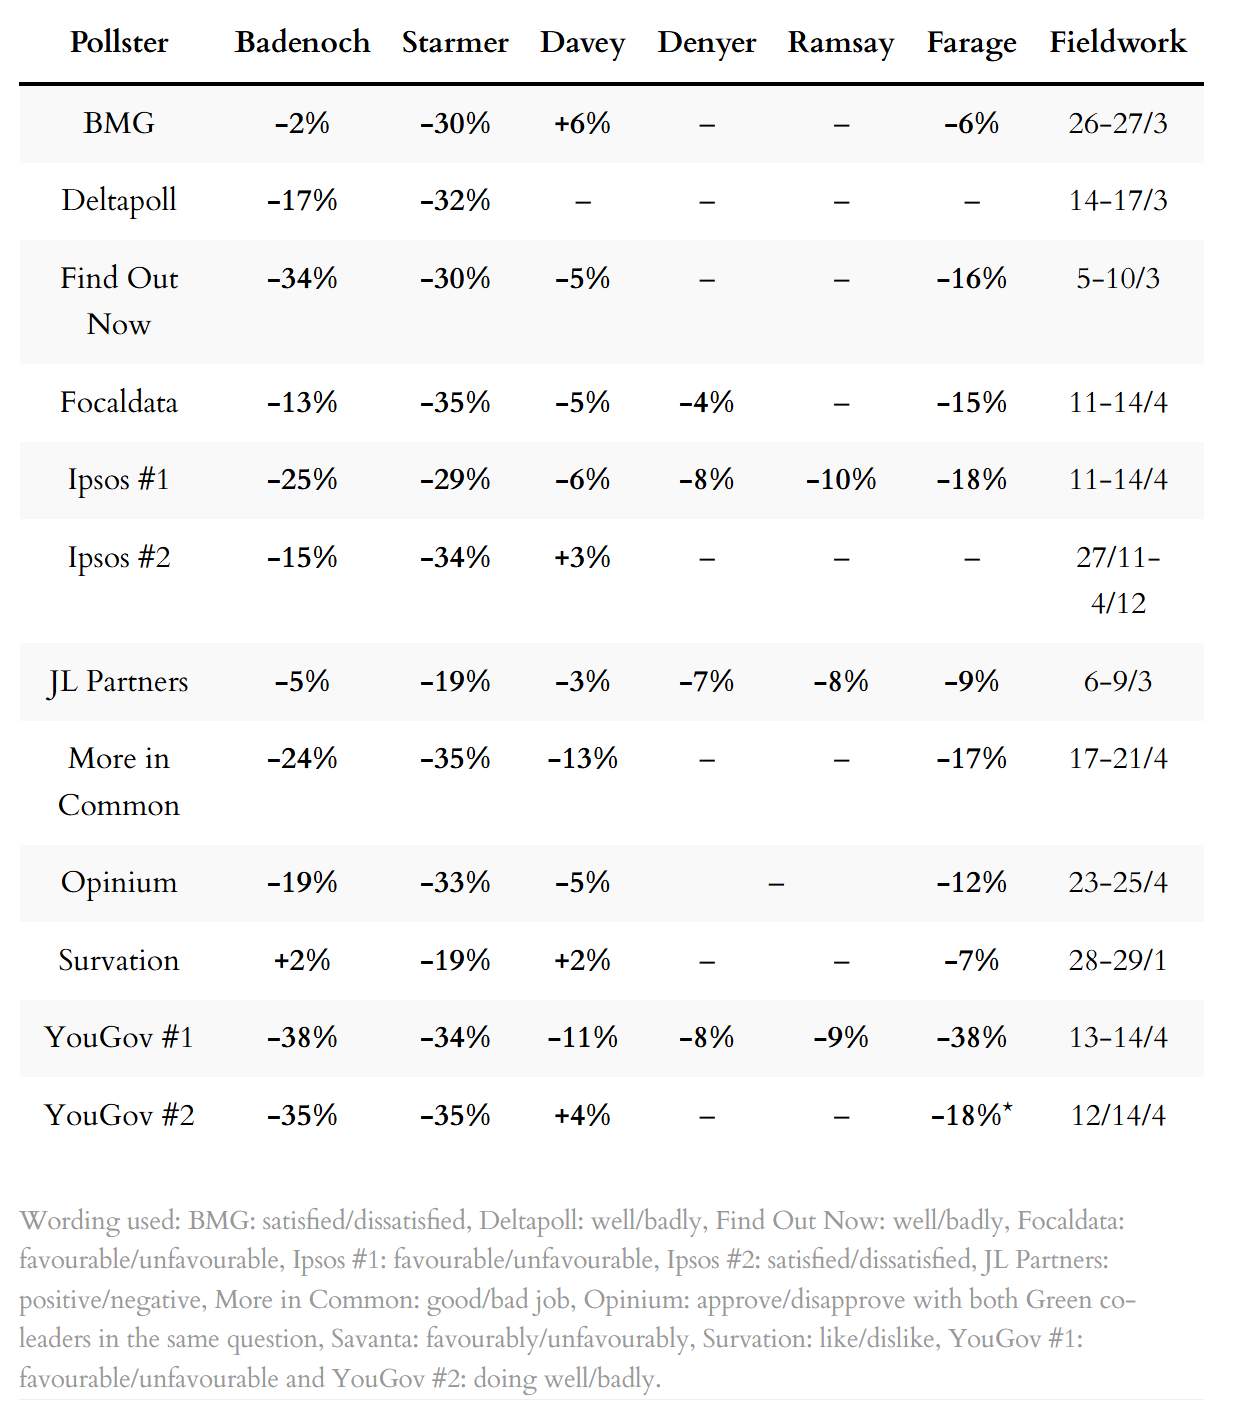
Finally, a summary of the latest leadership ratings, sorted by name of pollster:
For more details, and updates during the week as each new poll comes out, see my regularly updated tables here and follow The Week in Polls on Bluesky.
For the historic figures, including Parliamentary by-election polls, see PollBase.
Catch-up: the previous two editions
My privacy policy and related legal information is available here. Links to purchase books online are usually affiliate links which pay a commission for each sale. For content from YouGov the copyright information is: “YouGov Plc, 2018, © All rights reserved”.4
Quotes from people’s social media messages sometimes include small edits for punctuation and other clarity.
Please note that if you are subscribed to other email lists of mine, unsubscribing from this list will not automatically remove you from the other lists. If you wish to be removed from all lists, simply hit reply and let me know.
What are the experts predicting for the local elections?, and other polling news
The following 10 findings from the most recent polls and analysis are for paying subscribers only, but you can sign up for a free trial to read them straight away.
Ahead of the local elections several experts have put their reputations on the line
Keep reading with a 7-day free trial
Subscribe to The Week in Polls to keep reading this post and get 7 days of free access to the full post archives.


