


Pollsters split over what's happened to Labour's 2024 vote
Welcome to the 1687th edition of The Week in Polls (TWIP) which starts with sincere condolences to the family and many friends of David Lipsey, who died this week. A man of many talents, and a remarkable number of contributions to public life, he was particularly known to those interested in polling and elections for his membership of the Jenkins Commission on electoral reform and for chairing a House of Lords inquiry into the state of British polling.
This week, prompted by conversations with both Peter Kellner and Steve Akehurst, I take an initial look at a significant divide among pollsters. They split into very different camps in what they tell us has happened to the 2024 Labour vote.
Or if this was a clickbaity newsletter:
CHAOS IN THE CROSSTABS! Pollsters split into two warring camps over Labour’s slump.
Then it is a summary of the latest national voting intention polls, seat numbers from the latest MRPs and a round-up of party leader ratings.
Those are followed by, for paid-for subscribers, 10 insights from the latest polling and analysis.
This time, those ten include a questionable headline from The Times about Boris Johnson, a fabulous bit of context-setting for poll results from Ipsos by comparing new figures with a 47 year long average (!), and a horribly brilliant (or brilliantly horrible?) use of AI to explain polling by James Ball.
The Week in Polls often draws on the work of those at UK universities, so a little thank you for me in return with a special offer for anyone with a .ac.uk email address: you can sign up for the paid-for version of this newsletter at half price:
And with that, on with the show.
Want to know more about political polling? Get my book Polling UnPacked: the history, uses and abuses of political opinion polling.
What the voters are doing
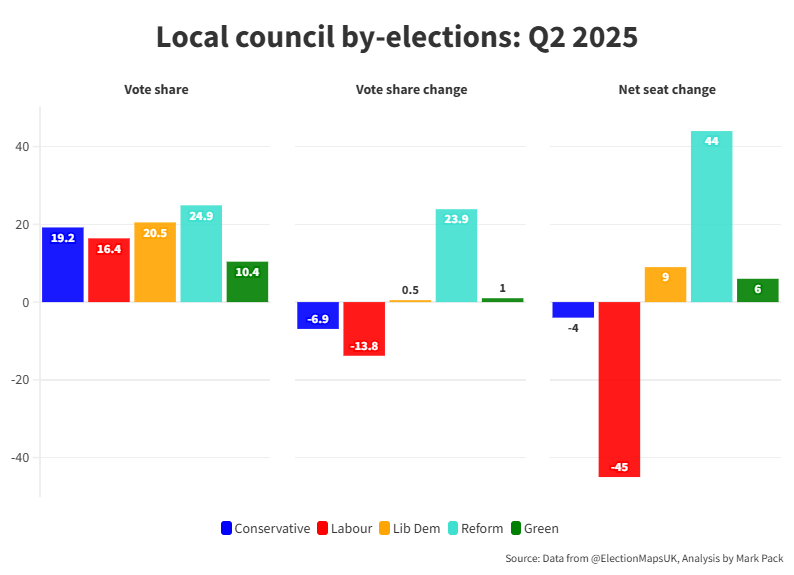
Time for my quarterly check-in on what the voters are doing when offered ballot papers rather than opinion pollsters’ questionnaires:
What is happening with the Labour vote?
Everyone agrees that Labour’s support is significantly down since the 2024 general election. But where has their support gone?
So far, answers to that question have either used the data from just one polling company (sometimes from one poll, sometimes from multiple polls combined) or used the averages across multiple pollsters.
The risk with relying on just one pollster is that their results may be at variance from other pollsters. Averaging different pollsters, however, also comes with a problem. As I’ve written before:
Averaging is sometimes a good way to head towards the truth. Yet on other occasions, it obscures the truth and is purpose-designed to give the wrong answer.
Imagine you are the first time visitor to a building you’ve not been to before and you’re sat in reception. The person on reception is busy at the moment and you need to head to the toilet. You ask a couple of other people sat there if they know where the toilets are. One says, “I think they’re down that corridor and then through the door on the left”. The other says, “Yeah, down that corridor but actually, it’s the door on the right”.
A true believer in averages would average out one left recommendation, one right recommendation and then stride confidently down the corridor and through the door in the middle instead. Neither left nor right but average. And almost certainly wrong.
Sometimes you have to choose, not average.
Averaging gets us a better answer if the truth lies somewhere in the middle of the data you have. But if some of the data is right and some of the data is wrong, averaging it together just pollutes the good with the bad.
So in seeking to answer the question of what has happened to Labour’s vote since the general election, I have collated, rather than averaged, the evidence from different pollsters. I have used all the polls carried out since late May. That is, since the rise for Reform in the polls levelled off. In the period since then, the polls have been fairly flat for each party, making it a good slice of time to use for analysis.
I have looked at two things in the crosstabs from the pollsters. First, taking their headline voting figures, what do those figures tell us has happened to 2024 Labour voters?
However, there’s a risk that looking just at the headline figures misleads us due to the different ways that, for example, pollsters treat don’t knows. If, say, two different pollsters find that 20% of Labour’s 2024 voters have switched to don’t know, but those pollsters have different ways of treating don’t knows when working out their headline voting intentions,1 then the crosstabs on their headline voting intention figures would show a different picture from each other even though their underlying data shows the same thing.
So the ideal second comparison would be to compare the data between pollsters from before adjustments for don’t knows, undecideds, turnout and so on. Alas, pollsters do not all publish comparable crosstabs from this earlier stage in their calculations.
They do provide crosstabs from an earlier stage in their calculations, before the headline voting figures are reached. But they vary in what stage those earlier crosstabs are taken from, and what information is given in them. For example, BMG gives from an earlier stage the percentage who say refused but not the percentage who say not voting, while Opinium does the opposite.
Comparing these ‘pre-headline stage’ crosstabs between pollsters therefore involves some comparison of apples to oranges. But heck, you can compare apples and oranges. (I have 3 apples. You have 4,762,911 oranges. Which of us has more fruit? You see, comparing apples and oranges is easy. The Romanians get it right by their version of the saying being that you can’t compare grandmothers and machine guns.)
Here then is the data split by pollsters for all the polls with fieldwork since late May.2 If a pollster had more than one comparable poll, its figures have been averaged.

There is a lot of data in this table, so I have included two summary columns. One shows how many 2024 Labour voters are - according to that pollster - now switched to Lib Dems, Greens or nationalists (the liberal and left switchers) and one shows how many have switched to Reform or the Conservatives (the populist and right switchers).
There is plenty of variation even within these two summary columns. To simplify matters further, then, here is a league table of pollsters, showing the ratio each pollster finds between liberal/left switchers and populist/right switchers. If, say, a pollster has twice as many going to the former than the latter, then the ratio is 2. But if three times as many go to the latter than the former, the ratio is 0.3.
Here is the listing:
Find Out Now: 2.7
YouGov: 2.2
Find Out Now / Electoral Calculus: 1.6
Ipsos 1.2
Techne 1.2
Opinium 1.1
More in Common 0.9
BMG 0.9
Freshwater 0.7
Survation 0.5
The variation here is striking. While Find Out Now has Labour losing almost three times as many voters to the liberal/left than to the populist/right, Survation has Labour losing twice as many to the populist/right as to the liberal/left.
At this point, I hoped that the pre-headline stage crosstabs might shed some light on the issue, but the league table is very similar with the ratios from those:
YouGov: 2.5
Find Out Now: 2.3
Find Out Now / Electoral Calculus: 1.7
Techne 1.2
Opinium 1.2
More in Common 0.9
BMG 0.9
Ipsos 0.8
Survation 0.6
Freshwater 0.6
YouGov nudges up to first place, Survation and Freshwater swap around and Ipsos falls a little. But this is substantially the same ordering and range of different answers.
One can perhaps group the pollsters into three:
YouGov, Find Out Now: Labour should be freaking out about Ed Davey
Freshwater, Survation: Labour should be freaking out about Nigel Farage
Everyone else: Labour should be freaking out about everyone
For the clickbaity pithiness of those bullet points, the basic point is this: different pollsters are telling us very different stories, with very different political implications.
What further clouds matters is that it is not obvious what those who clump together near each other in the league tables otherwise have in common.
For example, YouGov and Find Out Now do tend to have the smallest gap between the Lib Dems and Conservatives, but in that they are joined by Techne. Or the smallest Reform leads over Labour come with top of the table YouGov, mid table BMG and bottom of the table Survation.
Hopefully one or more of my very smart readers may be prompted to dig into this more and will find an explanation. I will also give it more thought.
For the moment, however, we don’t know what’s happened to Labour’s 2024 vote.
That is not good.
So, is this a case of chaos in the crosstabs?
Yes, but…
Yes, because these are big differences between pollsters, leaving us in ignorance.
But… even the lower figures for the liberal-left / populist-right split among Labour defectors still give that split as around 50:50. That is, Labour losing as many votes to the Lib Dems, Greens and nationalists as to Reform and the Conservatives.
That is a different picture from the one you would get from grazing through political news coverage, snacking on gossip about Morgan McSweeney and sampling Maurice Glassman quotes.
Even if the pollsters who show Labour losing the least to the Lib Dems, Greens and nationalists are right, reality is rather different from all that focus on Labour losing to Reform.
And if the polling camp at the other extreme is right, then reality isn’t just different, it’s in a whole different place.
So yes, the differences between the two polling camps should be cause for pollsters and polling analysts to look more at why the results are so different. But also, whoever is right and for whatever reason, political journalists and commentators should pay rather more attention to what the crosstabs say.
P.S.
Voting intentions and leadership ratings
Here are the latest national voting intention figures from each of the pollsters currently active, and continuing the picture of Reform’s rise in the polls in May having plateaued in June. There is perhaps a small recent slip too but if it is real it is a modest one, so far at least.

Next, the latest seat projections from MRP models and similar, also sorted by fieldwork dates. As these are infrequent, note how old some of the ‘latest’ data is:

Finally, a summary of the latest leadership ratings, sorted by name of pollster:

For more details, and updates during the week as each new poll comes out, see my regularly updated tables here and follow The Week in Polls on Bluesky.
For the historic figures, including Parliamentary by-election polls, see PollBase.
Catch-up: the previous two editions


My privacy policy and related legal information is available here. Links to purchase books online are usually affiliate links which pay a commission for each sale. For content from YouGov the copyright information is: “YouGov Plc, 2018, © All rights reserved”.3
Quotes from people’s social media messages sometimes include small edits for punctuation and other clarity.
Please note that if you are subscribed to other email lists of mine, unsubscribing from this list will not automatically remove you from the other lists. If you wish to be removed from all lists, simply hit reply and let me know.
Starmer still outpolls Farage, and other polling news
The following 10 findings from the most recent polls and analysis are for paying subscribers only, but you can sign up for a free trial to read them straight away.
Labour’s first anniversary in power has produced plenty of gloomy new polling data, showing how far the public has gone off Labour. But there is good news
Keep reading with a 7-day free trial
Subscribe to The Week in Polls to keep reading this post and get 7 days of free access to the full post archives.