Welcome to the 90th edition of The Week in Polls, which gives you five different ways to answer the question of whether the polls will close, and if so by how much. All five, handily, produce similar answers.
Then it’s the usual look at the latest voting intention polls followed by, for paid-for subscribers, 10 insights from the last week’s polling and analysis. (If you’re a free subscriber, sign up for a free trial here to see what you’re missing.)
Before we get to all that, a clarification about the graph last time titled, “Leavers and Remainers really don’t respect each other”. Each person’s views were recorded under only one category, so the total number of Remains with derogatory comments about Leavers is the sum of all the relevant blue bars and the total number of Leavers with derogatory comments about Remainers is the sum of all the relevant red bars. Therefore, although the X-axis scale only went up to about 15%, the totals in each of those two groups were much more than that.
As ever, if you have any feedback or questions prompted by what follows, or spotted some other recent polling you’d like to see covered, just hit reply.
Been forwarded this email by someone else? Sign up to get your own copy here.
Already a reader and know others who might enjoy this newsletter? Refer a friend and you can get up to 6 months of free subscription to the paid-for version.
Want to know more about political polling? Get my book Polling UnPacked: the history, uses and abuses of political opinion polling.
Should we expect the polls to close, and if so how far?
As you can see from the usual polling table further down, the Conservatives continue to be a long way behind in the polls. Hence my uses of yardsticks involving the Duke of Wellington or Michael Foot.
But how much - if at all - should we expect the polls to close between now and the general election? Or more precisely, how much of a difference should we expect between what the polls currently say and what the general election result turns out to be, accounting for both changes in the polls and polling error?
History can give us the formbook on this, telling us what’s typical to expect. There’s no one all-powerful authoritative calculation to make as several of the key elements can be measured in different ways. How exactly do we measure how the polls currently stand? How far away from general election polling day are we? And so on. Therefore it’s best to look at the picture drawn by a range of different calculations.
First up, Professor Rob Ford:
As this graph shows, every government for which we have relevant polls has done better in a general election than its worst midterm polling position. In nearly three quarters of cases, the improvement was in double figures.
Using the same calculation for this Parliament, the low for the government was an average opposition lead of 28 points. The average recovery in the graph is 15 points, which would take the government to… 13 points behind in the general election. For context, Jeremy Corbyn lost by 12 points in 2019 and Michael Foot by 15 points in 1983.
That 28 points, however, is from the Liz Truss era. So perhaps we should take the second worst, which is 22 points? If so, a 13 point improvement still leaves a 9 point deficit, worse than Ed Miliband in 2015.
Either way, then, this version of the history form book suggests closure but closure that would leave the Conservatives still well behind.
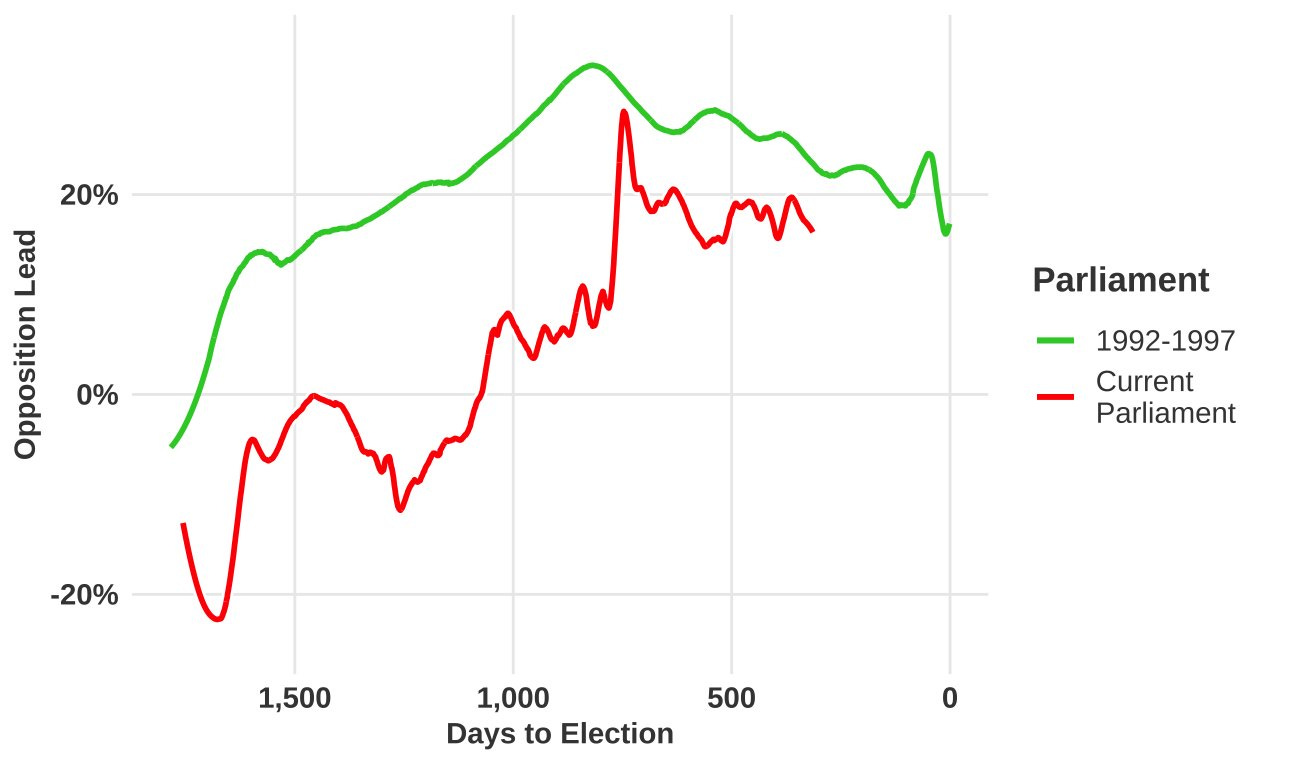
Next up, data guru Owen Winter and his graphs, looking at that much talked-about run-in to 1997 specifically:
As he puts it, “Labour's lead at this point in 1996 was ~23% while now it is ~16%. If the same squeeze as 1997 was replicated between now and the election, Labour would still win”.
Or to put it another way: the green line shows a Parliament in which ended with a landslide defeat for the Conservatives and the red line shows them consistently doing (even) worse than that.
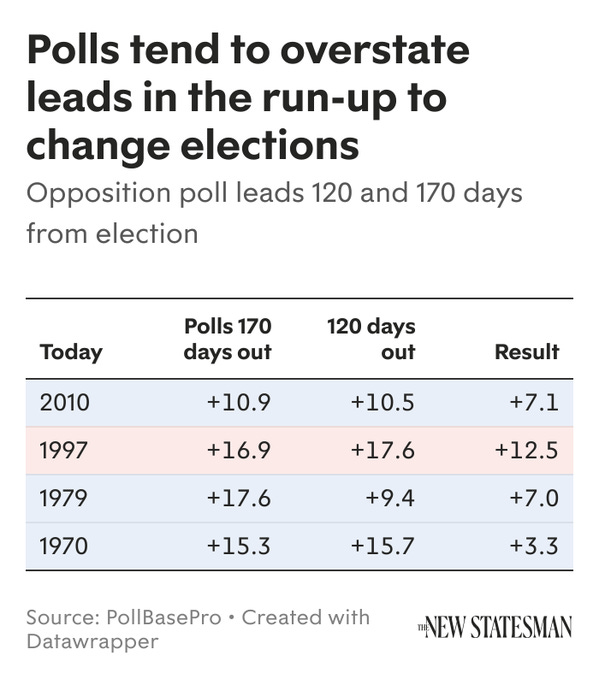
In addition to looking at the 1992-97 Parliament, we could also look at other Parliaments which resulted in a change of government. Ben Walker has crunched the numbers on that:
So that’s a narrowing of the lead by 4, 4, 11 and 12 points respectively (rounding off and comparing 170 days out with the result). There isn’t a PollBase Pro calculation for where we are currently,1 but it’s likely that it’d come out at around 15 points. Therefore those levels of improvement point towards a final Conservative deficit of between 3 and 11 points.
Still behind, although the best of those outcomes - a three point deficit - would, I predict, be seen as a remarkably good Conservative recovery on a par with, say, Gerald Ford’s recovery from 33 points behind in the polls ahead of the 1976 US Presidential election. He still lost, but his campaign manager’s reputation rose.2
For a fourth take, what about a more statistically complex analysis? Step forward Patrick Flynn from betting firm Smarkets, who have a particular interest in understanding the chances of political events.
Here’s his key graph:
As with Rob Ford’s analysis, this one also shows that government recoveries are normal, but with a wide spread for how far they recover. As Patrick Flynn puts it, “Labour's current 28-point poll lead (in red) produces an expected popular vote victory of around 8 points at the next election, looking at historical trends.”
One final take, which is my basic rule of thumb for general elections, as I wrote about for More Sex, Lies and the Ballot Box: Another fifty things you need to know about elections:
Across these fifteen elections [1964-2017, inclusive], in thirteen cases the party ahead in January went on to win. The two exceptions are of the sort that really do fit the ‘exception that proves the rule’ cliché.
One, in 2015, was a case when the opinion polls turned out to be way out. If you adjust polling figures from January 2015 in line with the polls’ final errors then the rule still works (as it does if you make similar adjustments for the other two general elections where the polls were way out).
The second exception is October 1974 where looking at the January figures is meaningless because going back to January means going back to before the previous general election.
The rule of thumb even held in 2019 (just).3 If it’s survived intact even the wild gyrations of both 2017 and 2019, I reckon it’s a pretty good rule of thumb.
All five takes, therefore, point the same way: it’s very plausible that the poll numbers close but there would also have to be a break with historical patterns for the closure to be enough to put the Conservatives level with or ahead of Labour. There’s one calculation above that resulted in only a low single digit Labour lead but most point higher than that.
It’s a different question about whether Labour will have a working majority or not as for that, in addition to the uncertainty around vote share, you have to then also add uncertainty around how far ahead Labour has to be to get a working majority. How efficiently will its vote be distributed, what level of tactical voting will there be and will the usual pattern of uniform swing occur or will this be a proportional swing election?
But given the dynamics of an incumbent government losing its majority and the likely unwillingness of other parties to vote back in a Conservative PM (e.g. the SNP might not like Labour but would they vote to put Sunak back in Downing Street?), doubt over whether Labour will have a majority, and if so of what size, is different from, and much greater than, doubt over whether Starmer will be Prime Minister.
So if that’s the historical par, are there any reasons to expect the new few months to turn out better or worse than par for the government? That’s mostly a matter of political rather than polling punditry.
One reason, though, for Conservatives to hope for an outcome better than history is the limited nature of the historical track record. There have only been 21 British general elections with opinion polls, and the first didn’t have midterm voting intention polls.
Yet perhaps we should expect smaller government recoveries these days given the way that independent central banks and globalised markets have restricted their ability to juice the economy ahead of polling day? Or perhaps we should expect larger recoveries to be possible due the increase volatility of the electorate? And anyway, there has not been a Parliament with a Liz Truss like episode in it before.
Perhaps inflation will fall surprisingly quickly and an unexpectedly mild 2024 will both cut fuel bills and reduce NHS waiting lists. Or perhaps the economy will take another downturn and inflation will spike thanks to international instability.
Maybe even, facing big poll deficits and a run of losing by-elections, the Conservatives will change leader again - and we’d be well off the modern history formbook with the fourth Prime Minister of a Parliament. The eighteenth century twice gave us Parliaments with five PMs, so who knows?4
Plenty to speculate on there, and there are things that could make a Conservative polling recovery much weaker than the historical formbook as well as ones that would make it stronger.
But what the formbook tells us is that it would take a recovery of the scale of a Liz Truss type disruption to politics, and this time to the government’s benefit, to get them to a plausible winning place.
National voting intention polls
So far, the voting intention polls this year show very little sign of any change in support beyond random statistical noise . That also means the run continues of no polls putting the Conservatives on more than 30%. They were last over 30% in June 2023.
Here are the latest figures from each currently active pollster:
For more details and updates through the week, see my daily updated table here and for all the historic figures, including Parliamentary by-election polls, see PollBase.
Last week’s edition
7 key points about British public opinion.
My privacy policy and related legal information is available here. Links to purchase books online are usually affiliate links which pay a commission for each sale. Please note that if you are subscribed to other email lists of mine, unsubscribing from this list will not automatically remove you from the other lists. If you wish to be removed from all lists, simply hit reply and let me know.
Progressives less keen to fight culture wars than the anti-woke, and other polling news
The following 10 findings from the most recent polls and analysis are for paying subscribers only, but you can sign up for a free trial to read them straight away.
Keep reading with a 7-day free trial
Subscribe to The Week in Polls to keep reading this post and get 7 days of free access to the full post archives.


