7 key points about British public opinion
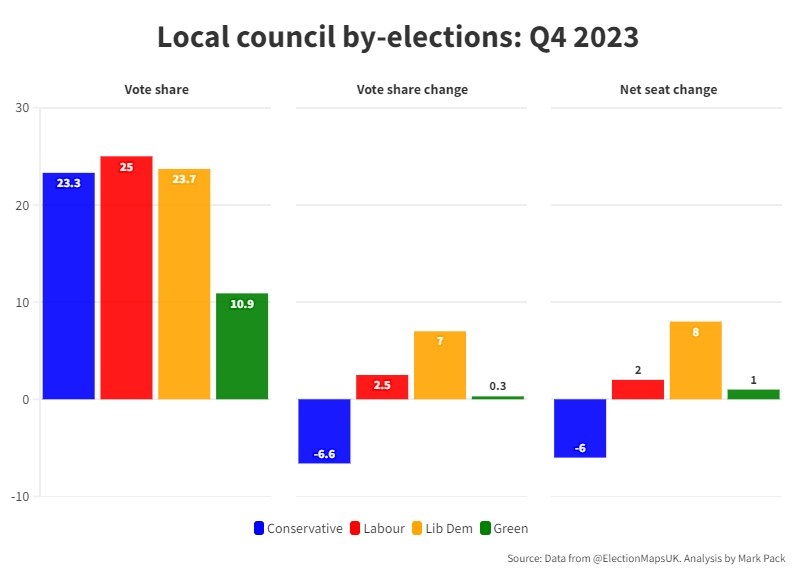
Welcome to the 89th edition of The Week in Polls, which as it’s the start of a new quarter kicks off with some actual voting results - council by-election aggregates for the last quarter - before diving into the findings from a great new polling report. Council by-elections need interpreting with a lot of care, but aggregated up that do reveal trends - such as, as you’ll see from the bar charts below, giving another angle on the limitations around Labour’s large poll lead.
Then it’s the usual look at the latest voting intention polls followed by, for paid-for subscribers, 10 insights from the last week’s polling and analysis. (If you’re a free subscriber, sign up for a free trial here to see what you’re missing.)
Before we get to all that, this week’s sigh of disappointment is triggered by the Financial Times which this week wrote that, “Neil Kinnock’s Labour was far ahead in the polls in 1992 before that ‘lead’ crumbled to dust”. The reality? Between 1 January 1992 and general election polling day there were, poetically, 92 voting intention polls. Only seven out of those 92 had a Labour lead of 5 points or more, and none had a Labour lead of more than seven points. There were never more than two polls in a row1 putting Labour five, six or seven points ahead. Labour was never “far ahead in the polls”.
As ever, if you have any feedback or questions prompted by what follows, or spotted some other recent polling you’d like to see covered, just hit reply. I personally read every response.
Been forwarded this email by someone else? Sign up to get your own copy here.
Already a reader and know others who might enjoy this newsletter? Refer a friend and you can get up to 6 months of free subscription to the paid-for version.
Want to know more about political polling? Get my book Polling UnPacked: the history, uses and abuses of political opinion polling.
Real votes in real ballot boxes2
Links to the graphs for the three previous quarters of 2023 are on my website.
7 key findings about the state of public opinion
UK in a Changing Europe continues to be one of the best sources of good polling analysis and nifty graphs. This time my praise is drawn by their new report, The state of public opinion: 2023. I’ve pulled out some findings below, but really the whole report is well worth your time.
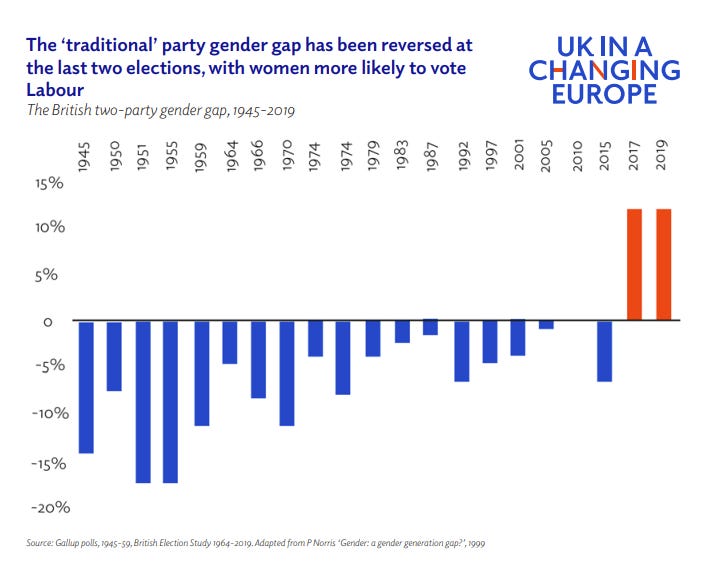
There’s been a big change in gender and voting
A seventy-plus years pattern now looks to be firmly broken and reversed. Although it does get mentioned, I don’t think the scale of mentions really measures up to the significance of what we’ve seen change in British politics (and where is the worry in the Conservative Party over this change?).3
Here’s what I’m on about:
The number of undecided voters is not unusually high
One graph, one story, one myth given a bash:
But a striking partisan divide has opened up:
Are voters getting more volatile?
One of the safest cliches to utter about British politics is about how we've been seeing unprecedented and rising volatility, including from voters.
But is is true?
Well, there are several different ways of defining what political volatility means. Some are safer grounds for the cliche than others. Churn in Prime Ministers, for example.
For voters changing the parties they vote for, however, the picture is rather more mixed:
There’s certainly an upward trend in the second half of the last century. But this century? Is that flat with a blip and a return to the mean, or is that a continuing rise? Duke it out in the comments to decide.
The public does not rate the government on the economy
Overall evaluations of the government’s performance produce similar graphs.
People think public services are in a mess
The bad scores for the NHS, hospitals, GPs and social care are particularly significant given how the NHS usually tops people’s lists of top issues.
Concern about the environment is holding up
When I started looking at polling seriously, the pattern I learnt was that the environment was mainly an issue for good times; i.e. that the worse the economy was going (or other big crises), the more environment fell away in people’s concerns. As this graph shows, that isn’t the pattern any more.
More on what issues most concern voters, and the different ways of asking about this, in one of last summer’s The Week in Polls.
Leavers and Remainers really don’t respect each other

Given that it’s Remainers who now wish to change the status quo,4 I think these figures should be more concerning for them than they are for Leavers.
But some good news for Remainers too:
That’s enough for here, but there is plenty more in the full report to enjoy and digest.
National voting intention polls
The new year starts as much of the last year went: without a poll putting the Conservatives on more than 30%. They were last over 30% in June 2023.
The lowest of low benchmarks, the Duke of Wellington’s crushing defeat in 1832, continues to be better than the current Conservative Party’s standing.
Here are the latest figures from each currently active pollster:
For more details and updates through the week, see my daily updated table here and for all the historic figures, including Parliamentary by-election polls, see PollBase.
Last week’s edition
How do the polls stand at the year end?
My privacy policy and related legal information is available here. Links to purchase books online are usually affiliate links which pay a commission for each sale. Please note that if you are subscribed to other email lists of mine, unsubscribing from this list will not automatically remove you from the other lists. If you wish to be removed from all lists, simply hit reply and let me know.
Changes to one of the highest profile MRP models, and other polling news
The following 10 findings from the most recent polls and analysis are for paying subscribers only, but you can sign up for a free trial to read them straight away.
Keep reading with a 7-day free trial
Subscribe to The Week in Polls to keep reading this post and get 7 days of free access to the full post archives.


