Are things looking up for the Conservatives in the polls?
Welcome to this week’s edition, which takes a look at the current fashionable polling topic: are the Conservatives heading back towards being able to hold on at the next general election?
As ever, if you have any feedback or questions prompted by what follows, or spotted some other recent polling you’d like to see covered, just hit reply. I personally read every response.
Been forwarded this email by someone else? Sign up to get your own copy here.
If you’d like more news about the Lib Dems specifically, sign up for my monthly Liberal Democrat Newswire.
My privacy policy and related legal information is available here. Please note that if you are subscribed to other email lists of mine, unsubscribing from this list will not automatically remove you from the other lists. If you wish to be removed from all lists, simply hit reply and let me know.
Are things looking better for the Conservatives?
The current fashion in political punditry is to talk about whether the political prospects for the Conservatives have turned a corner. As with most such punditry fashions, it has three key ingredients:
Op-eds that are heavy on insider vibes and light on hard evidence (with bonus marks this time around for the Evening Standard mis-tweeting its own piece) ;
A strong sense that it’s the story now because people have got bored with repeating the previous story; and
So let’s take a look at the evidence. Nearly 900 pieces of evidence. That’s the number of national voting intention polls so far since the 2019 general election, more even that the number of sitting members of the House of Lords.
There’s lots of clever stuff to be done with so much data but sometimes just staring at it in its simplest form reveals plenty and can be more useful than sophisticated analysis (as Anscombe’s Quartet beautifully shows).
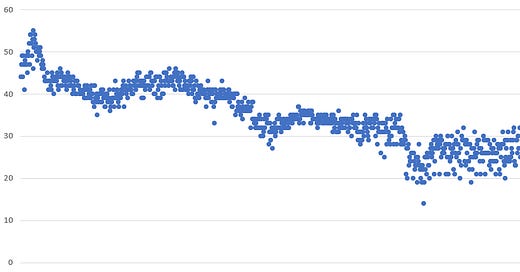
Here then is a graph of the Conservative vote share in each poll, plotted sequentially rather than against time (i.e. each dot is one poll, and each dot is the same distance further along, regardless of the actual time gap between polls).
It’s as crude a picture as you can get yet also a useful picture:
For all the excitements about individual polls, it’s a pretty clear picture for most of the graph. A long, steady decline in Conservative support, with a couple of plateaus along the way, and then off the cliff, plunging under Liz Truss.
I’ll turn to the final quarter of the graph in a moment, but before doing so it’s worth highlighting just how rare rogue polls are in this. There are a very few dots that look more than a smidgen out from the crowd of other polls at the time.
If anything, that should be a cause for concern rather than reassurance for pollsters, as the the paucity of rogue polls shows how much polling relies on adjusting raw data, squeezing out the sort of variability that true random sampling would have. It’s why, as covered in an earlier edition, the variability of Ipsos’s political polling is reassuring rather than a cause for concern.
Turning to that final quarter of the graph, there is what looks to be a clear outlier: that recent Deltapoll with a much narrower Labour lead. Overall, there’s a recovery from the lowest of the Truss lows, but also a fanning out of the polls, something that perhaps started before the Truss plunge. We’re getting much more variability between polls now than in earlier stages of the graph. Some of that is due to PeoplePolling with their results usually at the bottom end of Conservative ratings. But not all of it.
What appears to be another part of it is the difference between pollsters in how they treat someone who says ‘don’t know’ - how hard do you push them to pick a party, and if they don’t, how much do you use other evidence about them to impute an answer? (It may seem that leaving don’t knows as simply don’t know is the right thing to do, but plenty of pollsters who go beyond that have then predicted election results more accurately as a result.) That too seems unlikely to be the full story as this methodological conundrum pre-dates Truss.
There is, for the moment, a bit of a mystery here. (Do hit reply if you’ve got a smart explanation for this.)
But there are two things we can see. One is that there is a little bit of an up-tick in the average Conservative score in the most recent polls. But it’s small, perhaps a couple of points at most. Second that even with that uptick, nearly every poll from nearly every pollster is putting the Conservatives on a worse score than Corbyn’s Labour got in 2019 (33%), and the predominant majority have the Conservatives doing no better than Labour scored with Miliband in 2015 (31%). This is still nothing like a recovery to a respectable, let alone competitive, place.
It’s a story matched by other polling data - a bit of a recovery, but only to a level that would still be seen as dreadful on its own:


If hope comes from doing worse than Corbyn, it’s still very faint hope for the Conservatives.
National voting intention polls
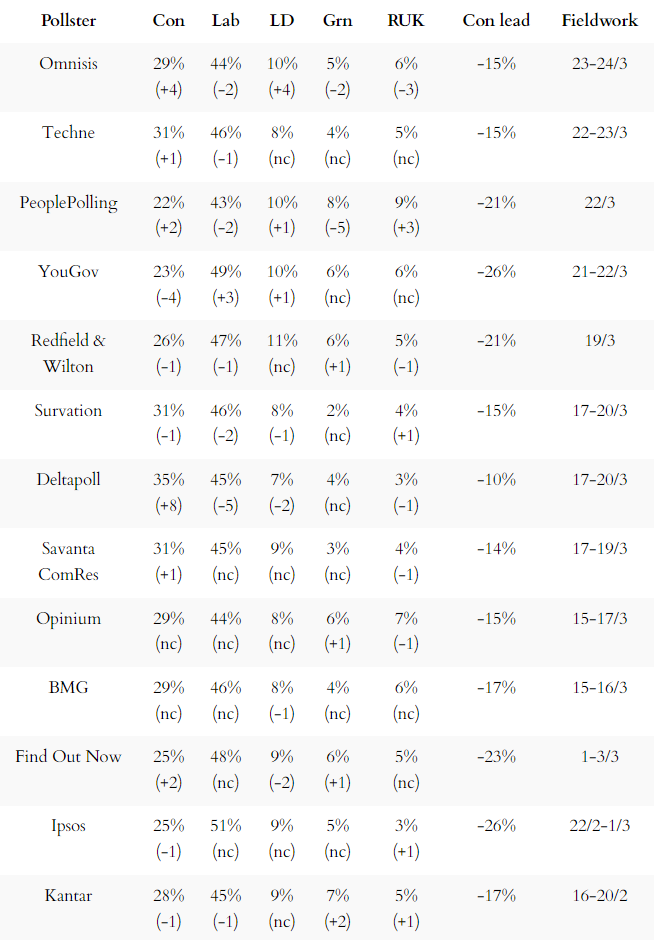
Here’s the latest from each currently active pollster:
For more details and updates through the week, see my daily updated table here.
Last week’s edition
How did the American election polls do?
Know other people interested in political polling?
Latest Scottish leadership polling and other insights from this week’s polling…
Keep reading with a 7-day free trial
Subscribe to The Week in Polls to keep reading this post and get 7 days of free access to the full post archives.


