How did the American election polls do?
Welcome to this week’s edition, which is shorter and less analytic than usual as I’ve been off at the Liberal Democrat conference in York moving the polls with my speeches. But by lucky timing there’s a great piece of US polling analysis to point you at.
As ever, if you have any feedback or questions prompted by what follows, or spotted some other recent polling you’d like to see covered, just hit reply. I personally read every response.
Been forwarded this email by someone else? Sign up to get your own copy here.
If you’d like more news about the Lib Dems specifically, sign up for my monthly Liberal Democrat Newswire.
My privacy policy and related legal information is available here. Please note that if you are subscribed to other email lists of mine, unsubscribing from this list will not automatically remove you from the other lists. If you wish to be removed from all lists, simply hit reply and let me know.
How did the American election polls do?
American politics have an outsized presence in the heads of politicos in Britain. Ask someone in this country to tell you about the electoral history of the Iowa caucuses or the UK’s metro mayor elections, and you’ll find plenty who can tell you more about the former than the latter.
So it is with a sense of self-loathing that I give you a story just about American polling this time around. However, it is relevant given that the track record of political polling in the US has an outsized influence on the reputation of political polling here in the UK.
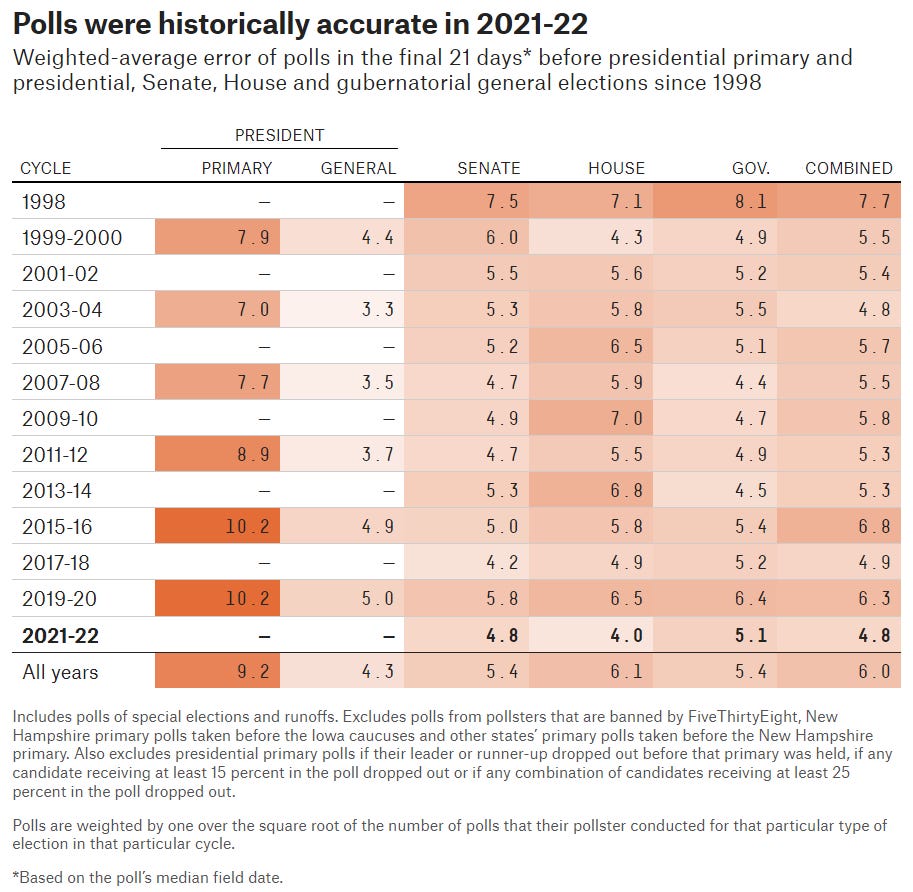
2022 was a good year for US pollsters, as a new analysis from Five Thirty Eight shows:
Let’s give a big round of applause to the pollsters. Measuring public opinion is, in many ways, harder than ever — and yet, the polling industry just had one of its most successful election cycles in U.S. history. Despite a loud chorus of naysayers claiming that the polls were either underestimating Democratic support or biased yet again against Republicans, the polls were more accurate in 2022 than in any cycle since at least 1998, with almost no bias toward either party.
This is their key table:
However, the polls were less good at calling the results correctly, i.e. having the actual eventual winner in the lead:
The main reason for the difference between these two findings - polls good compared with their past performance at getting vote shares right, polls less good at getting the winner right - is that there were more close races this time around (it’s easier to call the winner right if elections are won by large margins) and also that there was a decline in polling in safe seats.
All this is discussed in more detail in the site’s accompanying podcast. However, the one issue the team rather glides by with only brief pugnacious references is the question of whether being good on vote share or good on calling the winner matters more.
Which of these two polls would you consider the better?
Actual result: Conservatives 42%, Labour 38%
Poll A: Conservatives 48%, Labour 30%
Poll B: Conservatives 39%, Labour 40%
Poll A is poor on vote share (6 points over on Conservative, 8 points under on Labour) but correctly has the Conservatives ahead.
Poll B is very respectably close on vote share (3 points out on Conservatives and 2 points out on Labour). But while doing much better on vote share error, it wrongly has Labour ahead.
Put simply, pollsters and polling pundits don’t agree on which is best: whether being close on vote share is what polls are designed to do and so what they should be judged on, or whether really all people are interested in is who the winner will be and if polls can’t do that, then they’re failing. Perhaps someone should poll people to ask what matters more…
National voting intention polls
Here’s the latest from each currently active pollster:
For more details and updates through the week, see my daily updated table here.
Last week’s edition
What do the polls say about Sunak's immigration gamble?
I’ve updated a slip in what I originally wrote about the change required to go from 32% to 42% vote share. That’s not a 5% swing and I’ve sent myself to the David Butler Remedial School for more lessons in how to calculate swing. Thank you to Robin for pointing out my error.
I’ve also been reminded of this graph from John Burn-Murdoch which suggests that, at least in part, the falling salience of immigration is not due to more liberal attitudes but due to some newspaper editors deciding to write about other things.
Know other people interested in political polling?
John Curtice warns Labour over opposing tax cut for the rich and other insights from this week’s polling…
Keep reading with a 7-day free trial
Subscribe to The Week in Polls to keep reading this post and get 7 days of free access to the full post archives.


