Welcome to the 86th edition of The Week in Polls, which is a combination of follow-ups (to last week) and loose ends (interesting polling I’ve not yet covered otherwise this year).
Then it’s a look at the latest voting intention polls followed by, for paid-for subscribers, 10 insights from the last week’s polling and analysis. (If you’re a free subscriber, sign up for a free trial here to see what you’re missing.)
As ever, if you have any feedback or questions prompted by what follows, or spotted some other recent polling you’d like to see covered, just hit reply. I personally read every response.
Been forwarded this email by someone else? Sign up to get your own copy here.
Already a reader and know others who might enjoy this newsletter? Refer a friend and you can get up to 6 months of free subscription to the paid-for version.
Want to know more about political polling? Get my book Polling UnPacked: the history, uses and abuses of political opinion polling.
More polling and more graphs: immigration and Net Zero
Immigration follow-up
Three more graphs to follow up last time’s detailed look at polling on immigration.
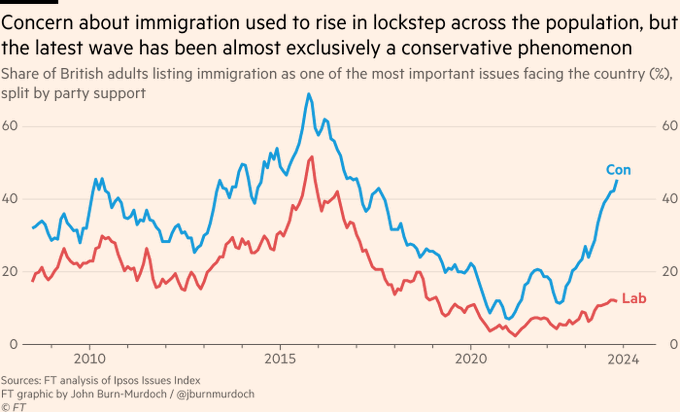
First, in the Financial Times John Burn-Murdoch has made some similar points to last week’s edition. Except it being him, he has better graphs:
Second, a graph from YouGov which is one of those graphs that I love because it shows that polling is often more static, less dramatic and more consistent across different groups than many people think:
All that noise, barely any movement.
The graph is nearly identical for Conservative voters specifically: that “badly” line is flat, high and in fact a couple of points higher.
The overall picture? The government is seeing (or making) its supporters become more concerned about an issue that they also think it’s doing badly on.
If the government can turn around its perceived (and actual) performance on the issue, then this could be a period of political growing pains. But if they can’t, it’ll likely turn out to have been an impressively counter-productive move.
Sunak’s scepticism on Net Zero policies doesn’t poll well
Steve Akehurst, polling expert and fellow Substacker reports:
I set up a small RCT (Randomised Control Trial) experiment with FocalData on the day of Sunak’s speech [announcing delays to some Net Zero policies]. A treatment group of voters saw a shortened version of this neutral BBC article regarding Sunak’s announcement, while a control group saw nothing. Both groups took the same survey at the end…
So what happened for the Conservatives in the treatment group compared to control? In short, not much good.
Among their target voters – Conservative 2019 voters; non-grads aged over 45 – there was no statistically significant change in the Conservative’s vote. It did not bring back ‘don’t knows’ nor Con-to-Lab switchers. Neither was there any greater positivity toward the party or Sunak himself. This is despite support for delay to the petrol/diesel phase out date being higher in these demographics than average.
The only meaningful movement is among under 45s and graduates. Here favourability towards both the Tories and Sunak plummets further…
Separately, this is backed up by a great new paper [from] Public First. Here, each survey respondent is asked which party they’d vote for, Party A or B – with both parties represented by a platform of 3 policies randomly chosen from a list of 21 (across a range of policy areas). In the analysis phase we can see which ideas have the biggest impact to which party voters chose – revealing their policy priorities.
The results show a number of striking things. Of most interest here is quite how poorly ‘Net Zero delay’ or expanded oil and gas drilling did – being among a handful of policies which actively repelled respondents. The blockbusting popularity of renewables also leaps out.
More details in his full post from October and do sign up to his Substack to get his insights promptly rather than with a lag of several months from me.
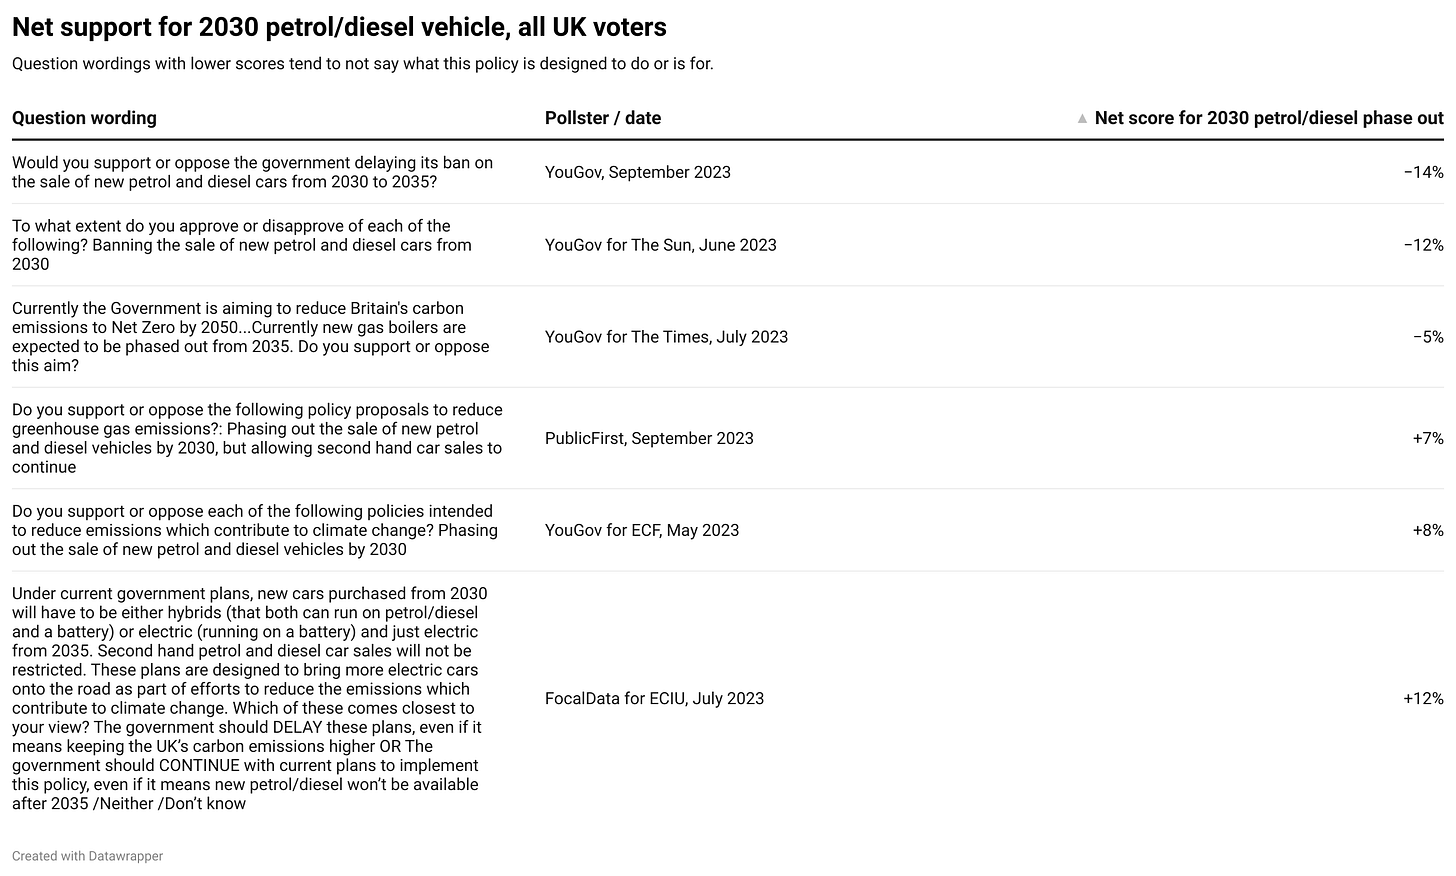
How question wording impacts views of green car policies
Steve Akehurst, again. This time using other people’s polling to show how the more the reasoning for green policies is given in a polling question, the higher the support for them:
Any other interesting polling from this year which I’ve missed? Just hit reply and let me know.
National voting intention polls
The run continues: it was another week without a poll putting the Conservatives on more than 30%, extending the run stretching back to late June 2023. The lowest of low benchmarks, the Duke of Wellington’s crushing defeat in 1832, continues to be better than the current Conservative Party’s standing.
Here are the latest figures from each currently active pollster:
For more details and updates through the week, see my daily updated table here and for all the historic figures, including Parliamentary by-election polls, see PollBase.
Last week’s edition
Is the polling changing on immigration?
My privacy policy and related legal information is available here. Links to purchase books online are usually affiliate links which pay a commission for each sale. Please note that if you are subscribed to other email lists of mine, unsubscribing from this list will not automatically remove you from the other lists. If you wish to be removed from all lists, simply hit reply and let me know.
Why the Conservatives are losing support, and other polling news
The following 10 findings from the most recent polls and analysis are for paying subscribers only, but you can sign up for a free trial to read them straight away.
Keep reading with a 7-day free trial
Subscribe to The Week in Polls to keep reading this post and get 7 days of free access to the full post archives.


