Welcome to the 134th edition of The Week in Polls (TWIP), which should be the most caveat-laden edition so far as I venture outside my main area of expertise1 and into a topic for which we are still missing some of the basic data: how did the opinion polls do in the US Presidential election?
Then it’s a summary of the latest national voting intention polls and a round-up of party leader ratings, followed by, for paid-for subscribers, 10 insights from the last week’s polling and analysis.
Before we get to all that, in a move that speaks very poorly of my commitment to getting through my ‘to do’ list this week, triggered by a comment YouGov pollster Anthony Wells I got one AI service to write a song about political scientist and polling expert Will Jennings and another AI service to set it to music. Behold the result:
I hope the next EPOP conference will feature a live performance from Will.
I really should spend more time on my ‘to do’ list.
If you’re not yet a paid-for subscriber, sign up now for a free trial to see what you’re missing:
Want to know more about political polling? Get my book Polling UnPacked: the history, uses and abuses of political opinion polling.
How did the polls do in the US election?
Ann Selzer, human after all
In the running to the USA’s polling day, I managed mostly to stick to variations of ‘I’ve no idea’ when asked who I think would win the Presidential race. My nearest departure from that was when the final poll from Ann Selzer came out. That is because she has a remarkable record of producing outlier polls which then turn out to be right. So when she produced a final poll that put Kamala Harris ahead in Iowa (Harris ahead in Iowa!) I even included a mention in last week’s edition.
But this was the election cycle when Ann Selzer turned out to be human too:
Ann Selzer poll in Iowa: Harris ahead by 3
President election result in Iowa: Trump ahead by 13 (with 99% of votes counted)
Ouch.
Double ouch in fact, because her previous big headline polling miss was a much closer affair. As I wrote in my polling book when looking at her record:
In the 2004 presidential election, she had Democratic nominee John Kerry winning the state over incumbent Republican George W. Bush by 3 per cent. The latter won (just, by under 1 per cent). Not a huge vote share error, but the headline was wrong. Moreover, her poll had, along with Surveyusa, stood out from the crowd in putting Kerry ahead. The other pollsters had it right.
As she’s said herself previously of being an outlier and wrong:
I call it spending my time in the pot-shot corral . . . Everybody saying this is terrible, she is awful, this is going to be the end of her . . . When we see the data, we know that’s going to be the reaction. But it’s a few days. A few days of discomfort, and the little talk I have with myself is, ‘look, we’ll see what happens. I’ll either be golden or a goat. Hopefully golden but if I’m a goat, ok I think I can survive it and move forward in some way, lessons learnt’. But it is uncomfortable.
Her failure this time is a reminder that political polls are in some ways like financial investments. (Though not nearly as profitable for those who provide them.)
Warnings such as, “Past performance is not a guide to future performance, nor a reliable indicator of future results or performance” bedeck investment material in the UK.
Polling is similar. The best pollsters are one election often are not at the next one.
I don’t think the evidence quite goes far enough to say there is no correlation at all between past performance and future performance for pollsters. (Do let me know if you’ve seen evidence that says otherwise!) I will come the next general election, for example, almost certainly say that the YouGov MRP model is the one to follow most closely for understanding the Lib Dme performance given its impressive track record, particularly in 2024.
But Ann Selzer’s revelation as a human like the rest of us is a reminder not to trust too much in your favoured pollster who did well last time.
All the other polls
OK, you may be thinking, it wasn’t just Ann Selzer who was wrong, was it? Weren’t all the polls wrong?
Well, no.
As 538/ABC News put it:

The picture painted by the polls was of a very close race, with a good chance that either Trump or Harris would win. Polling models gave it as either a 50:50 chance or very close to 50:50 between the two of them.
Likewise, if you look at vote shares, while the polls on average had Harris slightly ahead, the difference between those averages and the actual result2 is within what we should expect as the typical margin of errors on polls.
Indeed, wise polling-based commentators were making the comment in advance of the election that with an ordinary size polling error one way or the other, a clear win for Trump, a clear win for Harris or a knife edge result were all in the range of mainstream expectations.
The national polling averages
The combination of standard, reasonable sized poll average errors and, in effect, a mostly first past the post electoral system for winning states, means that a small margin on the votes can produce a big difference in the electoral college votes.
But the national polls themselves were pretty close.
Let’s take some data:
Final 538 average: Harris 48.0, Donald Trump 46.8
Final Economist average: Harris 48.9, Donald Trump 47.4
Final Nate Silver average: Harris 48.6, Trump 47.6
Final Real Clear Politics average: Harris 48.7, Trump 48.6
Result (at time of writing): Harris 47.9, Trump 50.4
Those final poll averages range from 48.0 to 48.7 for Harris and she got 47.9. For Trump they range from 46.8 to 48.6 and he got 50.4. Those are all numbers fairly close to each other.
What might have misdirected some was the consistency with which Harris was just ahead, which might give the appearance that the lead, although slim, was sure. But it is a common feature that when the polls are a bit off, many or even most of them are. Consistent close results do not come with a certainty generated by their consistency.
If someone was following the polls and then shocked by the result, the problem was with their understanding of the polls, not the polls themselves.
Although, to be fair, the FT’s John Burn-Murdoch does make a good point about how different graphical presentation can make the polls much clearer:
State polls
Yes Mark you may be thinking, but what about the state polls? You know, those polls that were badly off in 2016 even while the national polls were about right?
No, they weren’t a disaster either this time. The very opposite, in fact:
That point is also illustrated in this graph from the Deltapoll team:
The state polls were close. So again, the result was not a shocking contradiction of the polls.
Moreover, the polls did better on at least one important measure this time than in the any of the other Presidential elections this century:
But yes, there is something for pollsters to worry about
The appearance, yet again, of what appears to be a problem with under-reporting Donald Trump’s support means pollsters should not simply conclude all is well with their methodology.
As Rob Ford put it:
The polls were off in the same direction in every state as far as I can see, and in the overall national vote. Pollsters overall (with some exceptions) underestimated Trump across the board for a third election in a row. That looks like a systematic problem to me.
Martin Boon has another data point now in favour of his argument.
Yet even with that problem, the polls, read sensibly, were a decent guide. They didn’t point to a widely wrong result.
The polls also, very comfortably, out-performed the sort of vibes-based coverage that, at least for my timelines, frequently came up ahead of the results. Coverage of how good the Democrat ground game was, of how struggling the Republican ground game was and of how impressive turnout was looking in key areas for the Democrats. Sticking to just listening to the polls got you closer to, nor further from, the truth.
Why did Trump win?
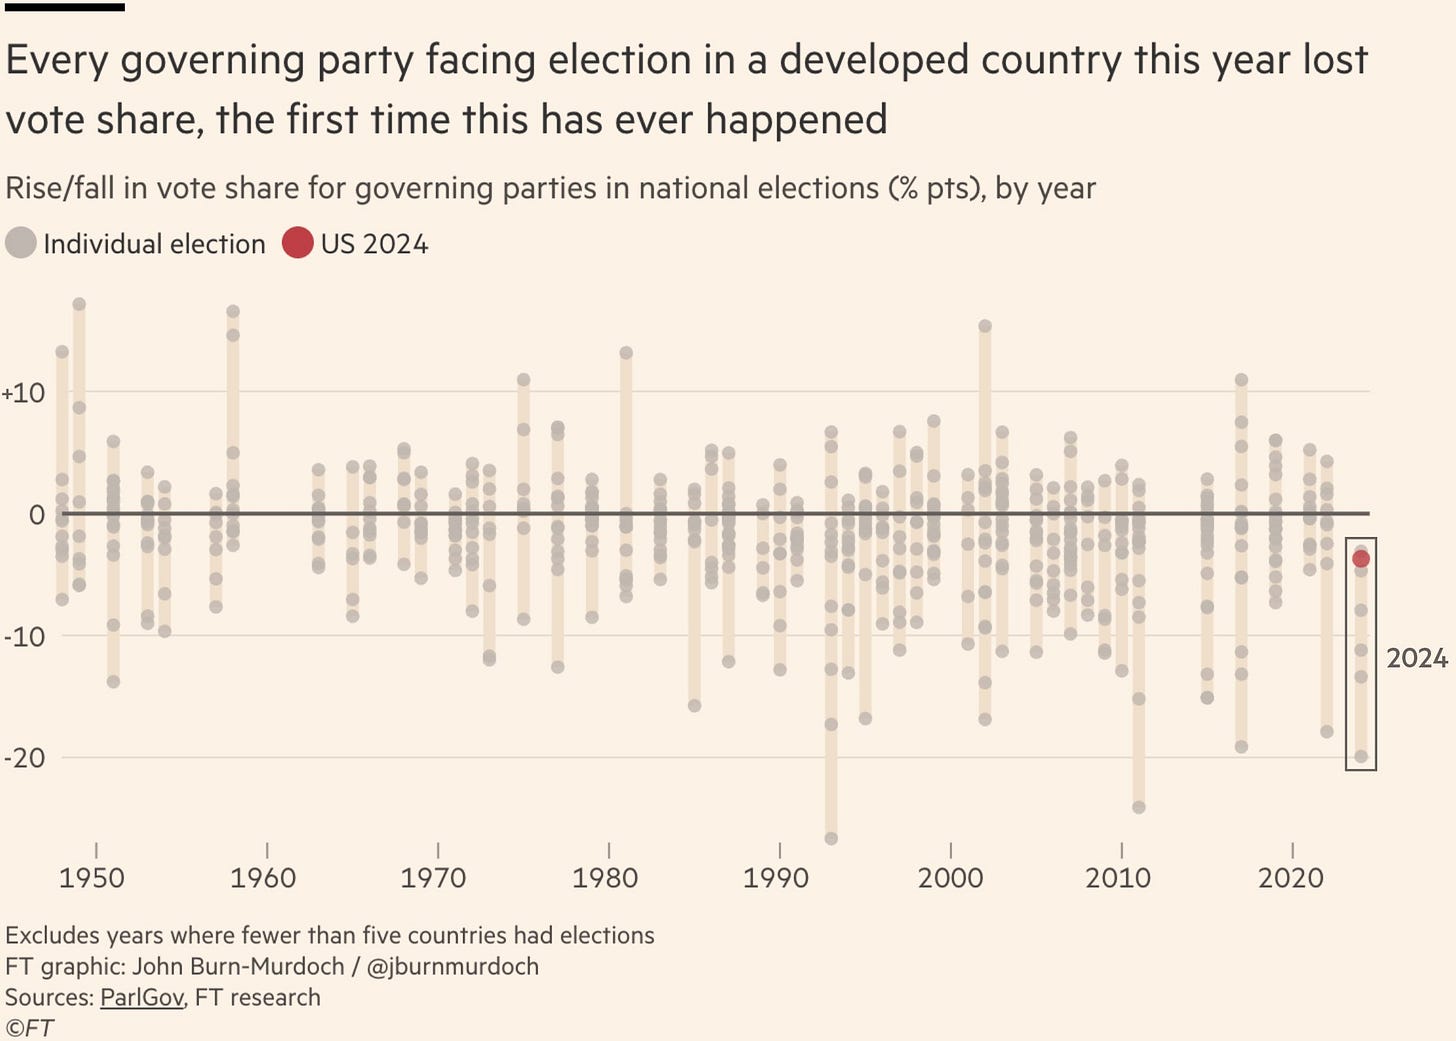
As for why the result was what it was, a large part of it is most likely down to the fact that we’re in an era where incumbents suffer:
Or in graph form:
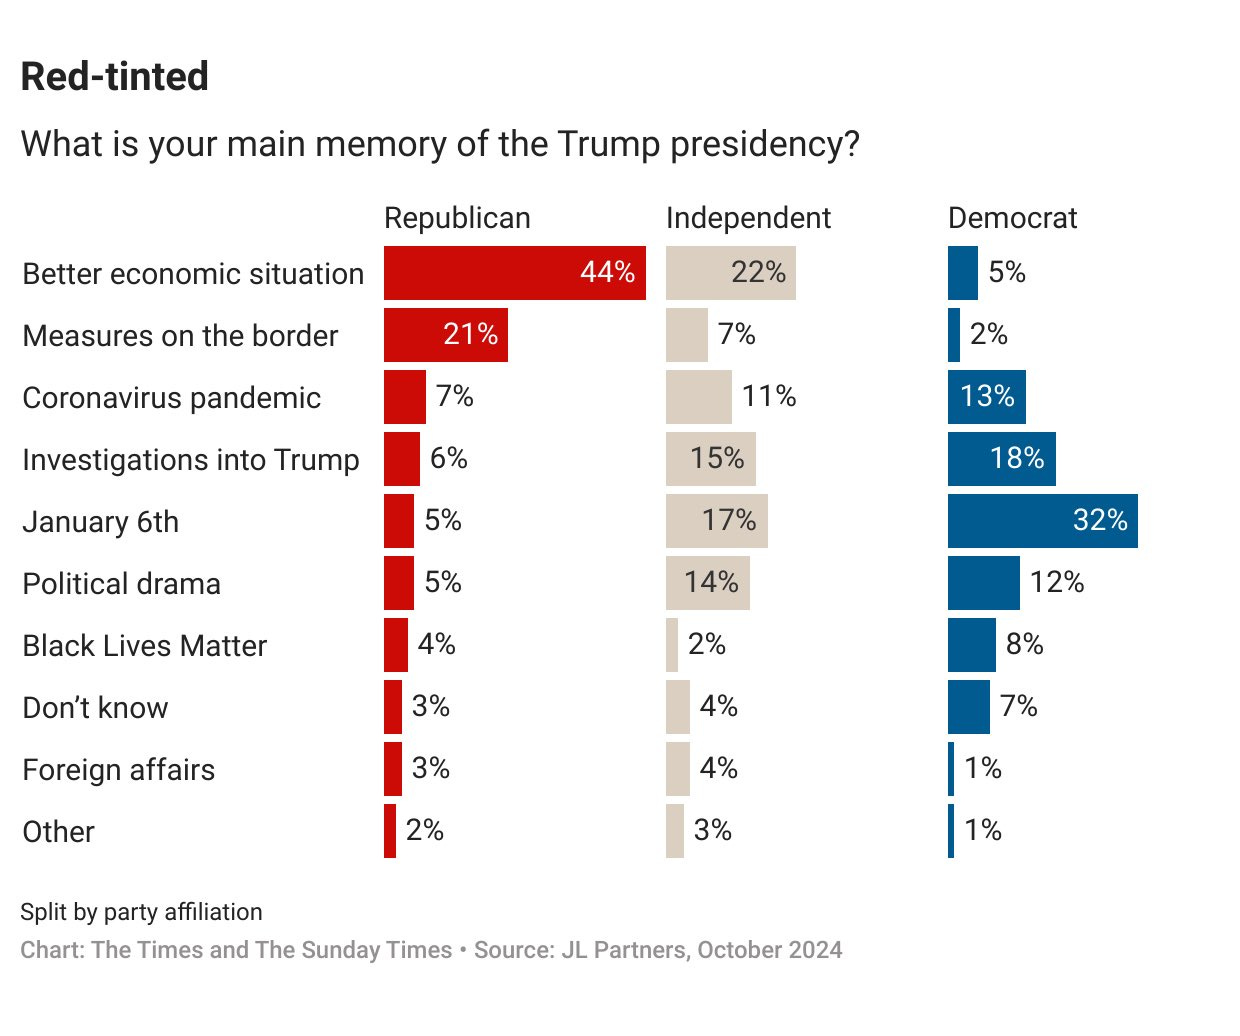
The evidence from US voters looks like this anti-incumbency mood was driven by memories of the economy being better in the past:
Look at what even independent voters put first in that list. I think Republicans and independents were wrong to, for example, put so lowly having a President trying to incite violence to stay in office. But it is their views that determined their votes.
Trump’s win was compatible with what the polls were saying, in line with what has happened in other elections this year and in tune with many voters’ views on the economy.
There are many things to be said about him winning. Saying it was a shock shouldn’t be one of them.
General election books
My latest election books review is of a book that is stuffed full of polling and focus group data:
Voting intentions and leadership ratings
Here are the latest national general election voting intention polls, sorted by fieldwork dates:
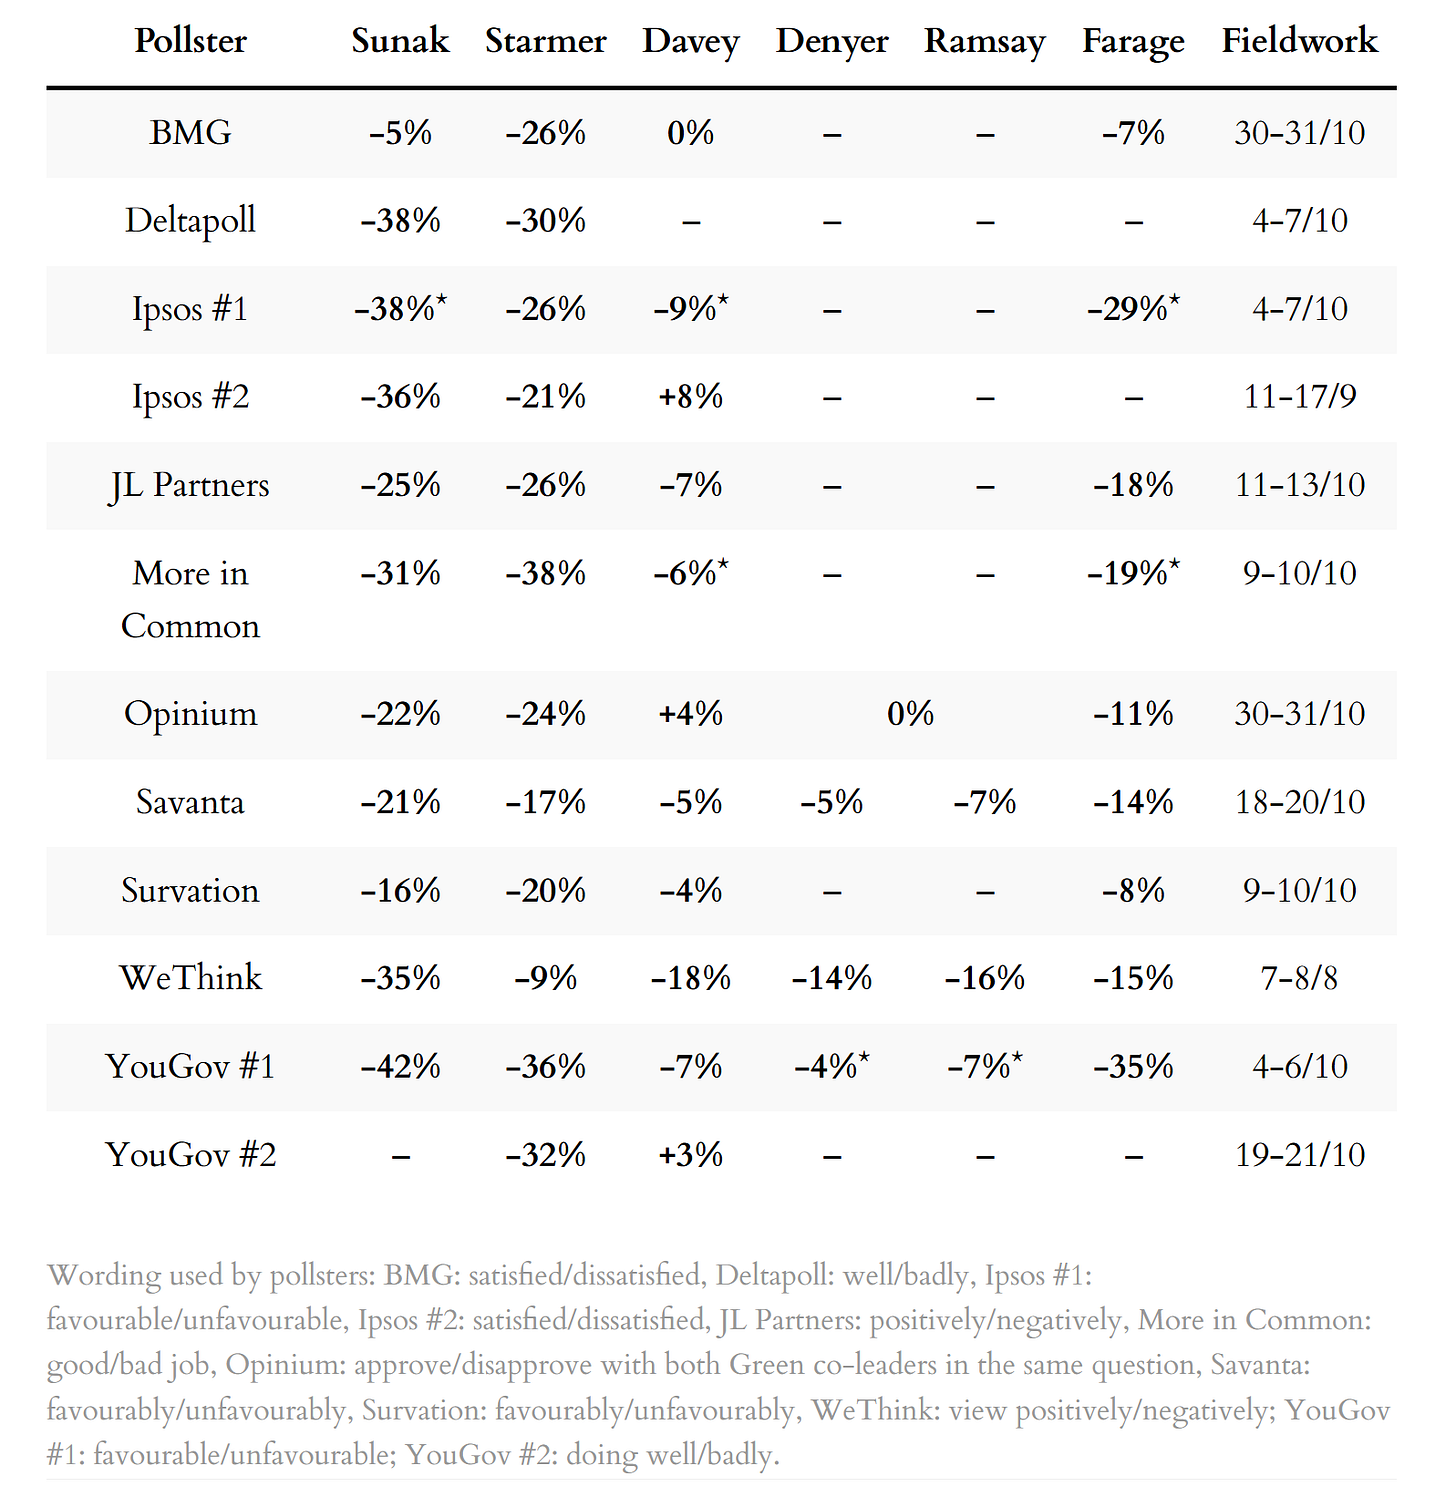
Next, a summary of the latest leadership ratings, sorted by name of pollster:
For more details, and updates as each new poll comes out, see my regularly updated tables here and follow The Week in Polls on Bluesky.
For the historic figures, including Parliamentary by-election polls, see PollBase.
Last week’s edition
Budget polling: what the early evidence says.
My privacy policy and related legal information is available here. Links to purchase books online are usually affiliate links which pay a commission for each sale. Please note that if you are subscribed to other email lists of mine, unsubscribing from this list will not automatically remove you from the other lists. If you wish to be removed from all lists, simply hit reply and let me know.
What do Britons think of Kemi Badenoch?, and other polling news
The following 10 findings from the most recent polls and analysis are for paying subscribers only, but you can sign up for a free trial to read them straight away.
YouGov polling from just before the Conservative leadership election concluded tell us that only 12% had a favourable opinion of Kemi Badenoch (45%
Keep reading with a 7-day free trial
Subscribe to The Week in Polls to keep reading this post and get 7 days of free access to the full post archives.


