Welcome to this week’s edition which is an experiment with something slightly different: follow-ups and footnotes to polling news I’ve covered before. I always like it when others do this, such as Planet Money’s ‘the rest of story’ shows1. Let’s see how it works for this newsletter.
But first, this week’s mild note of exasperation is directed at the i newspaper for getting over-excited and definitive about a change in polling figures that was within normal margins of error. You really shouldn’t use uncaveated phrases such as “surprise fall” when the data shows changes small enough that underlying reality may not be any fall at all.
It looks like Twitter may finally have a serious challenger, courtesy of Meta’s Threads. If you’re giving it a spin too, you can find me on it here.
As ever, if you have any feedback or questions prompted by what follows, or spotted some other recent polling you’d like to see covered, just hit reply. I personally read every response.
Been forwarded this email by someone else? Sign up to get your own copy here.
If you’d like more news about the Lib Dems specifically, sign up for my monthly Liberal Democrat Newswire.
My privacy policy and related legal information is available here. Links to purchase books online are usually affiliate links which pay a commission for each sale. Please note that if you are subscribed to other email lists of mine, unsubscribing from this list will not automatically remove you from the other lists. If you wish to be removed from all lists, simply hit reply and let me know.
Footnotes and follow-ups to previous polling stories
Conservative/Labour differences on top issues
Last week I wrote about what issues matter most to voters. The next day Redfield & Wilton released a handy breakdown between Conservative and Labour voters.
Note how, in a regular theme of mine, Labour and Conservative voters are pretty similar in their issue rankings. It’s immigration and housing where they vary significantly:
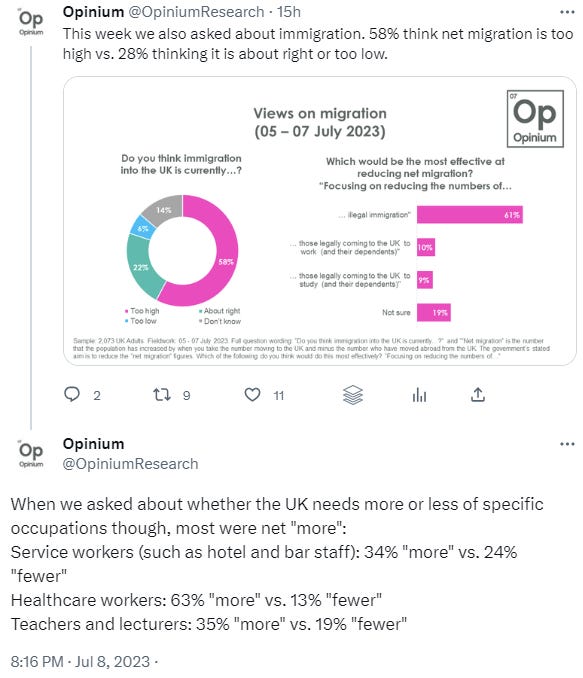
The public wants lower and yet also higher immigration
Some pollsters and pundits say without caveat that the public wants lower immigration, pointing to the answers to polling questions which (only) ask about overall numbers.
However, as I’ve covered before, it becomes a different picture when you ask about the different elements that comprise the total.
A new poll from Opinium, which asked the same people both sorts of questions, therefore neatly illustrates the paradox:
As Rob Ford points out:
(See also the Tim Harford story in the round-up below about differences between asking people what should happen overall to something and what should happen to the different elements that make up the overall total.)
What to make of the Mid Bedfordshire opinion poll?
Last year I wrote about by-election polls more generally. I’ve now done a piece specifically about the Mid Bedfordshire poll from Opinium.
The misleading mystique of internal polling
Leaking internal polling sounds more exciting and revelatory than it really is in 99% of cases. Having made that general point last year, I’ve returned to it this week with the claims about an internal poll for the Conservatives in the Mid Bedfordshire by-election.
House effects
A couple of weeks ago I wrote about variations between different pollsters in the combined Labour and Conservative vote share they find.
There’s a new piece of analysis out from John Handley about such house effects - that is, the pattern of a particular pollster (house) being consistently higher or lower in its findings for a party than other pollsters. This graph shows for each pollster and each party how many points higher or lower than the average of other pollsters their results are:
More details on Twitter.
Feedback please
Know other people interested in political polling?
Refer friends to sign-up to The Week in Polls too and you can get up to 6 months of free subscription to the paid-for version of this newsletter.
National voting intention polls
Polls out in the last week had the Conservatives on between 22% and 28%. Going down to comprehensive defeat in 1997, John Major polled 31%.
Here are the latest figures from each currently active pollster:
For more details and updates through the week, see my daily updated table here and for all the historic figures, see PollBase.
Last week’s edition
What issues most concern voters?
Why Tim Harford doesn’t like referendums, and other polling news
These weekly round-ups are for paying subscribers only, but you can sign up for a free trial to read them straight away.
Keep reading with a 7-day free trial
Subscribe to The Week in Polls to keep reading this post and get 7 days of free access to the full post archives.


