


Do long-term trends mean doom for the Conservatives?

If your new year has got off to a super-busy start, I can give you a super-short answer to the question posed for this week’s newsletter: “No”.
But let’s take a look at the longer answer. Especially given the burst of new readers who kindly signed up in the last few days. Knowing more about psephology is, it would appear, a popular new year resolution.
You’ll also see below the new format for The Week in Polls now that it has moved over to Substack and I’m running both free and paid-for versions. The idea is that everyone will get the introductory story and the summary of national voting intention polls, but then the summary of all the other political polling news from the last week will be in the paid-for version only.
Do let me know how you find this split works and you can sign up for the paid version here:
With that, on with the show…
My privacy policy and related legal information is available here. Please note that if you are subscribed to other email lists of mine, unsubscribing from this list will not automatically remove you from the other lists. If you wish to be removed from all lists, you can simply hit reply and let me know.
The trends of doom
Two different experts have pointed recently to two different long-term trends that look very gloomy for the Conservative Party’s prospects.
First, academic and pollster Patrick English, author of his own newsletter “
”. He tweeted:

Patrick’s point is a variant of a trend that previously had its time in the chatterati-limelight, namely the way that very Labour urban areas, especially London, are ‘exporting’ non-Conservative voters to more Conservative areas thanks to internal migration.
Such moves may take the edge of enormous Labour majorities in some urban seats, but in return make Conservative seats elsewhere less safe. Such long-term increase in the efficiency of the distribution of the non-Conservative vote would not be good news for Rishi Sunak’s party.
Especially as there’s more.
The Financial Times’s data wrangling expert John Burn-Murdoch has pointed out a very unusual pattern among Millennials in the UK (and the US). Unlike previous generations, they’re not getting more right wing as they get older:


So are the Conservatives doomed?
Well, not so fast… both pieces of analysis are good, and both seem to be based on solid data using sensible statistical analysis. Yet analysis of long-term trends that seem to point to doom for a particular party have often been wrong, both in the UK and the US.
In the UK, for example, the excellent book Must Labour lose? was followed by Labour winning four of the next five general elections. Or the equally good Turning Japanese? about Conservative dominance was followed by Labour’s only-ever run of three general election wins in a row. Similar predictions of Conservative doom have proved equally faulty:

Three things go wrong with such predictions.
First, remorseless long-term demographic and social trends can add up to only relatively small numbers per constituency changing (a point that Patrick acknowledges in his full Twitter thread). That matters at the margins in a close election, but matters much less for a party’s political prospects than whether it has as its leader Harold Wilson or Liz Truss.
Second, political shocks and other trends come along too. The future of British politics isn’t only going to be determined by age profiles and one generation. Just as Butler and Stokes were both right in that 1969 piece but also wrong in missing the other trends that worked against Labour.
Third, political parties are not - despite appearances at times - run by complete dolts. They can see an electoral problem and react to it. The British Conservative Party has show a remarkable ability to reinvent itself. As a result, it has won two of three elections since the Second World War. If long term trends are changing our politics, perhaps the party that has shown the most flexibility to move with the times is the one that should be favoured, not written off?
Both the second and third of those points explain the paradox at the heart of the excellent book Brexitland. I’d peg it as the best book on the trends shaping our politics. And yet it paints a picture of an increasingly liberal society at a time when the non-liberals have been on rather an election and referendum winning roll. (The answer to that paradox lies, in my view, in the two-speed liberalisation of Britain, something I wrote about here and discussed on my podcast with one of the co-authors, Rob Ford. For more on this, see my late September edition of The Week in Polls.)
So no, the Conservatives aren’t doomed. Those trends mentioned above will help the opposition parties at the next general election, but they won’t hand victory in a plate to anyone.
National voting intention polls
There have been very few over Christmas, so instead let’s compare the first and last polls of the year from pollsters who had national voting intention polls in both January and December of this year:
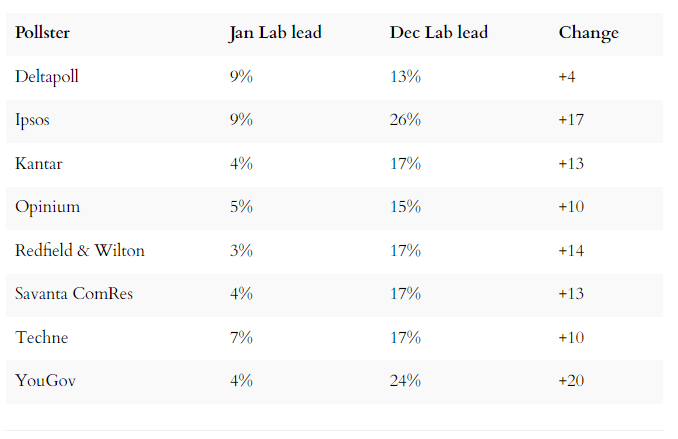
Not a happy picture for the Conservatives.
It’s worth noting too that the spread of leads at the start of the year – a 6 point spread between 3% and 9% – was much smaller than the spread at the end of the year – a13 point spread between 13% and 26%. At the moment that spread does not matter that much as the picture is the same in both cases: a large Labour lead.
But if the polls narrow and the spread doesn’t also narrow back to its early 2022 size, then the polls will start getting rather harder to interpret.
For all the latest national voting intention polls, see my daily updated table here.
How are we at predicting the polls?
Chapeau, readers and Twitter followers. Your predictions a year ago were pretty good:

Chance your arm with another prediction, this time for the polls in December 2023, here.
Know other people interested in political polling?
Keep reading with a 7-day free trial
Subscribe to The Week in Polls to keep reading this post and get 7 days of free access to the full post archives.